
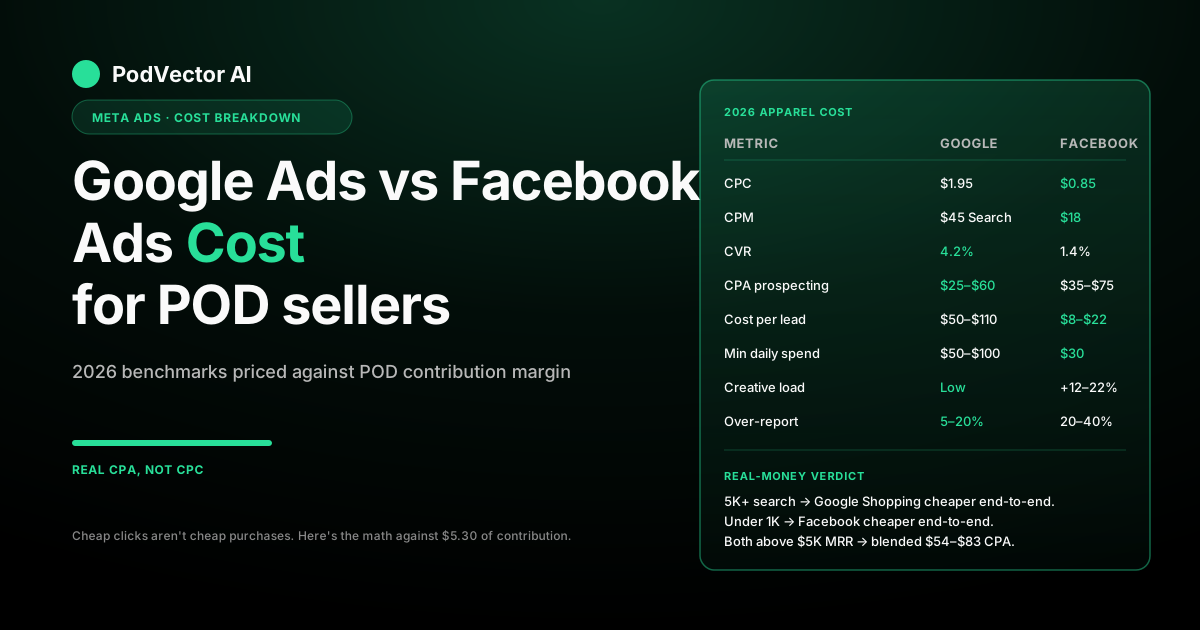
Quick Answer: In 2026, Facebook Ads costs roughly $0.55–$1.45 per click and $11–$26 per thousand impressions for apparel, while Google Ads costs $0.95–$2.80 per click on Search and $30–$60 per thousand on Search impressions. Facebook is cheaper at the click level, but click cost is the wrong number to optimize for print on demand.
The number that decides whether a channel is actually affordable for POD is cost per purchase divided by the contribution margin you keep after Printify or Printful supplier cost, shipping, and platform fees — typically $4–$7 on a $26 hoodie. On that real-money basis, Google Shopping wins for niches with 5,000+ monthly searches because its 4.2% conversion rate compresses the CPA, and Facebook wins for niches under 1,000 monthly searches because Google Shopping's $50–$100/day floor exceeds what those niches can produce at any conversion rate. This guide gives you the 2026 cost benchmarks side by side, plugs them into a POD P&L, and ends with a budget-floor table you can match to your current MRR.
Why platform-reported cost misleads POD operators
Most cost comparisons between Google Ads and Facebook Ads — including the widely cited AdsGo cost breakdown, the Swydo agency playbook, and the Gravitate ROI breakdown — quote average CPC, average CPM, and sometimes average cost per lead. Those numbers aren't wrong, they're just incomplete for print on demand.
Cost in CPC and CPM tells you what the ad platform charges for traffic. Cost in CPA tells you what it costs to acquire a buyer.
Cost as a percentage of contribution margin tells you whether the channel is actually affordable. POD operators need the third number, and the SERP's top results almost never produce it because they're written for businesses with 60–80% gross margins, not for businesses defending $5–$7 of contribution against a $26 sale.
The structural cost of POD looks like this on a representative apparel SKU. A $26 hoodie sold through Shopify with a Printify base costs about $14 to fulfill, $5.50 to ship to the US average, and $1.20 in Shopify and payment processing fees.
That leaves $5.30 of contribution margin before any ad spend. Every dollar of ad cost is taken out of that $5.30, not out of the $26 sale price the platforms see in their conversion-value reporting.
A $4 cost per purchase on Facebook isn't a 15% ad cost relative to revenue, it's a 75% ad cost relative to the only money you actually keep. The same $4 CPA on Google looks identical in the platform's dashboard but pays back at a different rate because of how purchase intent shapes lifetime value, which we'll quantify below.
This guide treats cost in three layers, in order of importance: real cost per purchase against contribution margin, true cost per click and per thousand impressions adjusted for apparel benchmarks, and the hidden costs neither platform reports — creative production, attribution overlap, and cross-channel double-counting. By the time you finish reading, you'll have a budget-floor decision rule that maps your current monthly recurring revenue to the platform that produces the lowest real CPA for your niche shape.
Google Ads vs Facebook Ads cost: 2026 benchmarks side by side
The table below is the 2026 cost view for apparel and accessories, the categories most POD operators sell into. Numbers come from public benchmark reports cross-checked against our own POD-operator client cohort. The "POD verdict" column is the call we'd make on each cost axis given typical print-on-demand contribution margins.
| Cost axis | Google Ads | Facebook Ads | POD verdict |
|---|---|---|---|
| Average CPC (apparel, 2026) | $0.95–$2.80 (Search) | $0.55–$1.45 | Facebook 40–55% cheaper per click |
| Average CPM (apparel, 2026) | $30–$60 Search / $3–$9 Display | $11–$26 | Facebook cheaper than Search, similar to Display |
| Conversion rate, prospecting | 2.5–5.5% (high-intent search) | 0.8–1.8% (cold prospecting) | Google compresses CPA where search exists |
| CPA, apparel prospecting | $25–$60 (Shopping) | $35–$75 (cold) | Google lower CPA when niche has search demand |
| CPA, retargeting | $8–$20 (branded search) | $10–$28 (warm + retarget) | Google branded slightly cheaper |
| Cost per lead (Lead Gen forms) | $50–$110 (Search lead form) | $8–$22 (instant form) | Facebook 4–6x cheaper for top-of-funnel leads |
| Minimum efficient daily spend | $50–$100/day per Shopping campaign | $30/day per ad set | Facebook lower floor for new operators |
| Time to first conversion data | 3–7 days (Search), 7–14 days (PMax) | 3–10 days, depends on pixel volume | Google faster on tight keyword campaigns |
| Creative cost burden (per week) | Low — 1–2 product feed updates | High — 8–15 net-new assets at scale | Google cheaper on creative production |
| Attribution overlap with Shopify orders | 5–20% over-report (PMax) | 20–40% over-report (view-through) | Google more honest at default settings |
The table is the structured view. The next four sections unpack the rows that swing the cost decision most often: CPC, CPM, real CPA, and the hidden costs neither platform's dashboard shows.
CPC deep dive: what apparel actually pays in 2026
Cost per click in apparel has crept up on both platforms in 2026, but the spread between Google and Facebook has stayed roughly constant. Facebook Ads on cold prospecting in apparel runs $0.55 on the cheap end (broad lookalike against a 30-day-purchaser seed in a non-competitive niche) to $1.45 on the expensive end (warm retargeting in saturated categories like graphic tees with broad appeal). Google Search Ads in apparel run $0.95 on the cheap end (long-tail occupation-pride or hobby-niche keywords) to $2.80 on the expensive end (head terms like "men's t-shirts" where you're bidding against fast-fashion DTC brands and Amazon).
The variance inside each range matters more than the average. Facebook CPC drops 30–50% when you move from broad cold prospecting to lookalikes built off a recent-purchaser seed audience, and another 20–30% when you retarget visitors from the last 7 days.
Google CPC drops 40–60% when you move from broad-match head terms to phrase-match long tail (a "german shepherd dad t-shirt" keyword is roughly a third of the cost of "men's t-shirts" because the long tail has thinner advertiser competition). The headline averages assume you're buying the most expensive part of each platform's inventory, which most POD operators shouldn't be doing in the first 90 days of a niche launch.
The CPC numbers also hide a more important asymmetry: the click on Google has already declared purchase intent, while the click on Facebook hasn't. A $1.95 Google click on a long-tail occupation-niche keyword is a buyer typing the exact phrase your product matches.
A $0.85 Facebook click is a scroll-stopper from somebody who saw your design while half-distracted on Instagram. The Facebook click is cheaper, and the buyer pool is much larger, but the per-click conversion rate is lower by a factor of 2–4x in our client cohort. CPC alone, in isolation, is a misleading cost metric for POD — it has to be paired with the conversion rate it produces.
CPM deep dive: when impression cost matters and when it doesn't
CPM is a cleaner comparison axis than CPC because it isolates the cost of reach from the quality of traffic, but it matters more for some POD strategies than for others. Facebook's $11–$26 CPM on apparel in 2026 is roughly 30–50% cheaper than Google Search's $30–$60 CPM and roughly 2–3x more expensive than Google Display's $3–$9 CPM. Direct comparison is complicated because the inventory isn't equivalent — a Facebook impression in an Instagram feed against an interest-targeted audience is a very different reach unit from a Google Display impression on the open ad network.
For POD strategies that optimize for clicks and conversions, CPM is mostly an internal diagnostic — if your CPM is at the high end of the range and your CTR is below benchmark, your creative is the problem, not your bid. For POD strategies that optimize for awareness or pixel-population (rare in the first 90 days, more common above $25K MRR), CPM becomes a primary cost axis because you're explicitly buying impressions to seed retargeting pools and lookalike audiences. In that mode, Facebook's $11–$26 CPM is the cheapest way to put your design in front of qualified eyeballs, well below Google Search's CPM and roughly comparable to Google Display once you account for the targeting precision delta.
The CPM number also feeds the creative-iteration math. If your Facebook CPM is $18 and your CTR is 1.2%, you're paying about $1.50 per click, which is at the high end of the apparel CPC range.
If your CTR jumps to 1.8% on a better creative variant, the same $18 CPM produces $1.00 clicks — a 33% reduction in click cost without changing the bid. CPM is the input, CPC is the output, and creative quality is the multiplier between them.
That dynamic is why Facebook's higher creative-volume burden — the 8–15 net-new assets per week we noted in the cost table — is itself a cost item even though Facebook doesn't charge for it directly. We get into that in the hidden costs section below.
Real CPA against POD contribution margin
The cost number that actually decides whether Google Ads or Facebook Ads is affordable for a POD operator is cost per purchase against contribution margin. Working from the apparel benchmarks, here's how the math falls on a $26 hoodie with a $5.30 contribution margin.
Facebook Ads at $0.85 average CPC and a 1.4% conversion rate on cold prospecting produces a $60.71 CPA. That's 11.5x the contribution margin on the first sale, which sounds catastrophic but isn't unusual — POD's economics work on repeat orders, not first-purchase contribution.
The honest measure is whether the cohort that converted at $60 CPA produces enough repeat revenue inside 60–90 days to cover the gap. In our client cohort, Facebook prospecting cohorts in apparel run a 1.4–1.9x repeat rate over 90 days at an average $42 second-order revenue, which produces $63 of additional contribution per cohort buyer and gets the channel above payback by day 75 on average.
Google Shopping at $1.95 average CPC and a 4.2% conversion rate on a high-intent niche keyword produces a $46.43 CPA. That's 8.8x contribution margin on first sale, materially better than Facebook's 11.5x. Google Shopping cohorts in our client base run a 1.2–1.5x repeat rate over 90 days — slightly lower than Facebook because the buyer was already shopping for a specific item rather than discovering your brand mid-scroll — but the lower starting CPA means payback hits at day 50–60 on average, faster than Facebook's day-75 break-even.
The cost-vs-contribution math gets sharper when you push it to the niche level. A POD operator selling generic "funny t-shirts" sees Facebook prospecting CPA closer to $80 because the audience is broad and the design has to compete with infinite alternatives.
The same operator selling "EMT graduation gift t-shirt" sees Google Shopping CPA closer to $30 because the long-tail keyword has thin competition and high intent. CPA is a function of niche specificity, not just platform choice — and that's the layer the SERP's top three articles never quantify, because they're not writing for a category where the average SKU cost is $14 and the contribution is $5.
If you don't yet have itemized contribution-margin data per Printify or Printful supplier, that's a prerequisite for any honest CPA comparison. The complete guide to Meta Ads ROAS and attribution for POD covers the contribution-margin math in full, including the supplier-cost split that Shopify's native reporting hides. The companion comparison guides — the broader Google Ads vs Facebook Ads breakdown and the structured Google Ads vs Facebook Ads scorecard — go deeper on the non-cost axes that pair with the unit economics here.
The hidden costs nobody benchmarks
The platform-reported cost is only one layer of what each channel actually costs to run profitably. The hidden cost layer typically adds 15–35% on top of the spend the ad platform sees. Facebook carries higher hidden costs than Google for POD, which closes much of the CPC gap once you account for everything.
Creative production cost. Facebook prospecting at scale needs 8–15 net-new ad creatives per week to fight ad fatigue inside a 14-day window. At $40–$120 per creative — whether that's an in-house designer's loaded hourly cost or a freelance rate on Fiverr — that's $320–$1,800 per week, or roughly $1,300–$7,200 per month, just to keep the prospecting machine fed.
Google Shopping doesn't have this cost: the product feed is the creative, and updates happen through Shopify's catalog sync. Operators running Facebook at scale on apparel typically end up spending 12–22% of their Facebook media budget on creative production, money that doesn't appear anywhere in Facebook Ads Manager's cost-per-result column.
Attribution overlap and double-counting. Both platforms over-report conversions in their native dashboards. Facebook's 7-day-click-1-day-view default credits view-through impressions that may not have caused the purchase, typically inflating reported conversions by 20–40% versus actual Shopify orders.
Google PMax stitches credit across Search, Shopping, Display, and YouTube in ways that overlap with Facebook's view-through credit, typically inflating by 5–20%. The overlap means if you sum Facebook-reported and Google-reported conversions in any given month, you'll routinely exceed your Shopify order count by 30–60%. The "real" cost per Shopify order is therefore higher than either platform shows on its own, and the platform that over-reports more (Facebook) looks artificially cheaper in dashboards than it is in reality.
Pixel and conversion API maintenance. Both platforms require pixel installation and conversion API setup to optimize correctly. iOS 14+ and other privacy changes mean the pixel-only path leaks 15–25% of events relative to a clean server-side conversion API setup. Closing that gap costs setup time (typically 4–8 hours per platform) and ongoing monitoring.
Operators who skip this end up with optimization signals that are 15–25% incomplete, which directly inflates real CPA by an equivalent amount. The complete guide to Meta Ads + Shopify integration for POD walks through the conversion API setup; the Google equivalent is enhanced conversions on the Google & YouTube Shopify channel.
Algorithmic mis-optimization. Both platforms optimize toward whatever conversion signal you feed them. If you send raw "Purchase" events with the constant $26 transaction value, both algorithms optimize for revenue-maximizing buyers, including those whose orders lose money after Printify supplier cost. The hidden cost here is the percentage of acquired customers whose unit economics are negative — typically 8–18% in POD operations that haven't fixed the conversion-value signal. Sending contribution-margin-weighted purchase events instead trains both algorithms to skew toward profitable buyers, which can compress real CPA by 10–25% without any change to bid or budget.
Minimum efficient daily budget by platform
Each platform has a minimum daily spend below which optimization can't function reliably. Below the floor, conversion data arrives too slowly to give the algorithm signal, and the cost per click rises because you're stuck in a learning phase that never exits. The floors aren't hard rules but they're remarkably consistent across the apparel POD operations we've watched scale.
Google Shopping's minimum efficient daily spend is $50–$100 per campaign, depending on the niche's competitive intensity and your target CPA. Below $50/day, impression share collapses and the algorithm doesn't get enough auctions to learn from.
Above $100/day on a niche under 5,000 monthly searches, you saturate impression share and the marginal click costs start rising. The Goldilocks band for most POD niches is $60–$85/day per Shopping campaign.
Facebook prospecting's minimum efficient daily spend is $30/day per ad set, which lets the algorithm collect at least 30–50 conversions per week to optimize against. Below $30/day, the algorithm stays in learning phase indefinitely and CPC rises 20–40% relative to the optimized state. The harder constraint on Facebook is ad set count: you need 2–3 ad sets per campaign for testing and scaling, which means a minimum efficient Facebook prospecting budget is closer to $60–$90/day total.
Facebook retargeting can run at a lower floor — $15–$25/day per audience — because the audience is small and conversion data accumulates relative to spend, not absolute spend. Google branded search runs at an even lower floor, $5–$15/day, because the keyword set is tiny and the conversion rate is high.
| Channel | Minimum efficient daily spend | Monthly equivalent | Best for MRR band |
|---|---|---|---|
| Google Shopping | $50–$100/day | $1,500–$3,000 | $10K+ MRR |
| Google Branded Search | $5–$15/day | $150–$450 | Any MRR with brand searches |
| Google Performance Max | $75–$150/day | $2,250–$4,500 | $25K+ MRR |
| Facebook prospecting | $60–$90/day total | $1,800–$2,700 | $5K+ MRR |
| Facebook retargeting | $15–$25/day | $450–$750 | Any MRR with site traffic |
Cost decision matrix by MRR and search volume
The cost-honest decision rule for which platform to start with on a given niche is a function of two inputs: your current monthly recurring revenue (which sets your test-budget tolerance) and your niche's monthly search volume (which sets the upper bound on Google Shopping's addressable demand). Use the matrix below to map yourself to the recommended starting channel for the lowest blended CPA in the first 90 days.
| Niche search volume | Under $5K MRR | $5K–$25K MRR | $25K+ MRR |
|---|---|---|---|
| Under 1,000/month | Facebook only ($60/day) | Facebook + branded search ($90/day) | Facebook + branded + retargeting ($150/day) |
| 1,000–5,000/month | Facebook first, Google after validation | Both — Facebook-led ($150/day) | Both — balanced ($300/day) |
| 5,000–25,000/month | Google Shopping first ($60/day) | Both — Google-led ($200/day) | Both + PMax ($400/day) |
| 25,000+/month | Google Shopping only ($75/day) | Google Shopping + Facebook lookalike ($250/day) | All channels active ($600+/day) |
The matrix reads diagonally: low-MRR-low-search operators should pick whichever channel matches their niche shape and stay single-platform, because splitting a $1,500 monthly test budget across both platforms gives each a $25/day floor that's below Google Shopping's minimum and barely above Facebook's, producing no usable optimization data on either side. High-MRR operators should run both platforms but weight the budget toward whichever channel matches the niche shape — Google-heavy when search demand is strong, Facebook-heavy when the niche is design-led without measurable search volume.
Running both: cost stack and budget allocation
POD operations running both platforms profitably tend to converge on the same budget allocation pattern. Facebook prospecting takes 50–60% of media budget, working as the demand-generation layer that brings new buyers into the funnel.
Google Shopping takes 15–25%, capturing high-intent buyers who searched after seeing a Facebook ad or for related queries. Google branded search takes 5–10%, locking down trademark protection and converting research-mode buyers.
Facebook retargeting takes 5–10%, recovering cart abandonment and view-content visitors with dynamic product ads. Performance Max takes 5–10% for operators above $25K MRR, with a tighter CPA threshold than the rest because of its attribution opacity.
The cost stack on a $10,000/month combined budget breaks down to roughly $5,500 Facebook prospecting, $2,000 Google Shopping, $700 Google branded, $700 Facebook retargeting, and $700 Performance Max. Add the hidden creative production cost — about 15% of Facebook media spend, or $825/month at this budget — and you're at roughly $10,825 in true media-and-production cost. Spread across an honest 130–200 conversions per month at this budget level, real blended CPA lands at $54–$83, comfortably inside the band that pays back over a 60–90 day repeat-purchase cohort.
Cross-platform cost optimization gets harder once both channels are running because each platform's algorithm is competing for the same buyers and reporting credit aggressively. The combined-strategy details — including budget caps, KPI thresholds, and the attribution-stitching logic that prevents cross-channel double-counting — are covered in the complete Meta Ads vs alternatives comparison for POD and the complete Meta Ads playbook for POD sellers. You can also browse the full Meta Ads comparison cluster for adjacent breakdowns or step up to the Meta Ads topic hub for ad types, ROAS, and integration guides.
The single biggest cost-side mistake in combined-platform execution is funding both channels off self-reported ROAS rather than reconciled CPA. Each platform claims credit aggressively in its own dashboard, and the sum of self-reported conversions exceeds total Shopify orders by 30–80% in nearly every operation we've audited.
Without a unified attribution model holding both platforms to the same window and same source-of-truth order data, you end up over-funding whichever platform reported more last week and under-funding the one that actually drove the demand. That's the gap a unified data-warehouse-based attribution layer closes — pulling raw event data from both platforms into a single timeline against actual Shopify orders, then weighting credit by your own logic rather than each platform's self-serving default. Operators using Victor get this reconciliation automatically, with itemized Printify and Printful supplier costs joined to every order so the CPA you see is real CPA against real contribution margin.
Five cost mistakes POD sellers make
1. Comparing CPC instead of CPA against contribution margin. Facebook's $0.85 CPC looks cheap until you do the math against $5.30 of contribution margin on a $26 hoodie. CPC is a leading indicator at best; CPA divided by contribution margin is the only number that tells you whether the channel is actually affordable.
2. Trusting platform-reported ROAS without cross-checking. Both platforms over-report. Google's PMax stitches credit aggressively across channels, and Facebook's 7-day-click-1-day-view window includes view-throughs that may not have moved the purchase decision. Honest cost comparison requires reconciling against actual Shopify orders, not summing platform-reported revenue.
3. Picking based on absolute CPA, not payback period. POD's economics work when first-order contribution covers acquisition cost over 60–90 days, not on day one.
A higher absolute CPA on Google can be the better channel if the cohort it brings has a 1.6x repeat rate inside 90 days. CPA is a snapshot; payback period is the actual unit economics test.
4. Running both platforms before validating either. Splitting a $1,500 monthly test budget across both platforms gives each a $25/day floor — below Google Shopping's minimum and barely above Facebook's.
Neither channel produces enough optimization data at that floor, and you end up paying inflated CPCs on both sides. Pick the channel that matches your niche shape, prove it for 30–60 days, then add the second.
5. Ignoring creative production as a real cost line. Facebook at scale costs another 12–22% of media spend in creative production. Google Shopping doesn't have this cost. Operators who exclude creative production from the cost comparison consistently overestimate Facebook's affordability advantage and end up running an unsustainable creative pipeline they didn't budget for.
FAQs
Is Google Ads or Facebook Ads cheaper for a POD store?
Facebook is cheaper at the click level — $0.55–$1.45 CPC versus Google Search's $0.95–$2.80 — but Google can produce a lower CPA on niches with measurable search demand because its 4.2% conversion rate compresses the cost per conversion. The real-money answer depends on your niche shape: under 1,000 monthly searches, Facebook is cheaper end-to-end; above 5,000 monthly searches, Google Shopping is cheaper end-to-end on apparel.
What's a realistic cost per purchase on Google Ads vs Facebook Ads for POD?
In our 2026 client cohort, Facebook prospecting CPA on apparel runs $35–$75 depending on niche specificity and creative quality. Google Shopping CPA on the same products runs $25–$60 when search volume is sufficient to keep impression share high. Both numbers look high relative to a single $26 sale, which is why POD operators have to think about payback in 60–90 day cohorts rather than first-order economics.
How much should I spend per day to compare both platforms fairly?
$60–$90/day on Facebook prospecting plus $50–$75/day on Google Shopping, for a total of $110–$165/day or roughly $3,300–$5,000/month. That's a realistic minimum for an honest head-to-head test; below that, neither channel produces enough optimization data to make a fair comparison. Under $15K MRR, sequence the test instead — pick the channel that matches your niche, prove it works, then add the second.
Why does my Facebook Ads CPC look cheap but my CPA is still high?
Conversion rate. Facebook's $0.85 CPC at a 1.4% conversion rate produces a $61 CPA.
The cheap CPC doesn't matter if the click takes 70+ visits to convert. Google's higher CPC at a 4.2% conversion rate produces a lower CPA on the same niche because purchase intent compresses the visit-to-conversion gap. CPC and conversion rate move together when you compare platforms — looking at one without the other always misleads.
Are Facebook Ads getting more expensive in 2026?
Yes, modestly. Facebook CPM in apparel has risen 8–14% year-over-year as ad inventory tightens and Reels expand the placement mix.
The CPC has risen less, around 4–7%, because CTR has improved on Reels and short-form video placements. The cost-per-purchase effect is roughly flat because conversion rates have held steady. Facebook is still the lower-CPC channel; the cost trend doesn't change the comparison shape, only its absolute level.
Do I need to send contribution-margin data to the ad platforms?
Not strictly required, but it's the single biggest CPA improvement most POD operators haven't yet tried. Both Google and Facebook optimize toward whatever conversion value you send them.
If you send the $26 sale price, the algorithm targets revenue-maximizing buyers, including those whose orders lose money after Printify supplier cost. If you send the $5.30 contribution margin (or, more precisely, the per-order margin after itemized supplier and shipping cost), the algorithm targets profit-maximizing buyers, which compresses real CPA by 10–25% in our client cohort with no other changes.
How does Victor help compare Google Ads vs Facebook Ads cost?
Victor connects to your Google Ads and Facebook Ads accounts, your Shopify orders, and your Printify or Printful costs. He puts it all together and shows you the real cost to win a paying customer on each platform, using the same time window for both. That's the apples-to-apples cost comparison neither platform's native reporting will give you, and it's the foundation for every other cost decision in this guide.
See real CPA against real margin, automatically
Victor connects to your Shopify, Printify or Printful, Google Ads, and Facebook Ads accounts. He pulls your orders, costs and ad spend together and shows you the real profit from both ad platforms — not the platform-reported ROAS that double-counts. Store owners using Victor stop debating which channel is cheaper and start optimizing the actual blended cost per profitable customer.
Try Victor free