
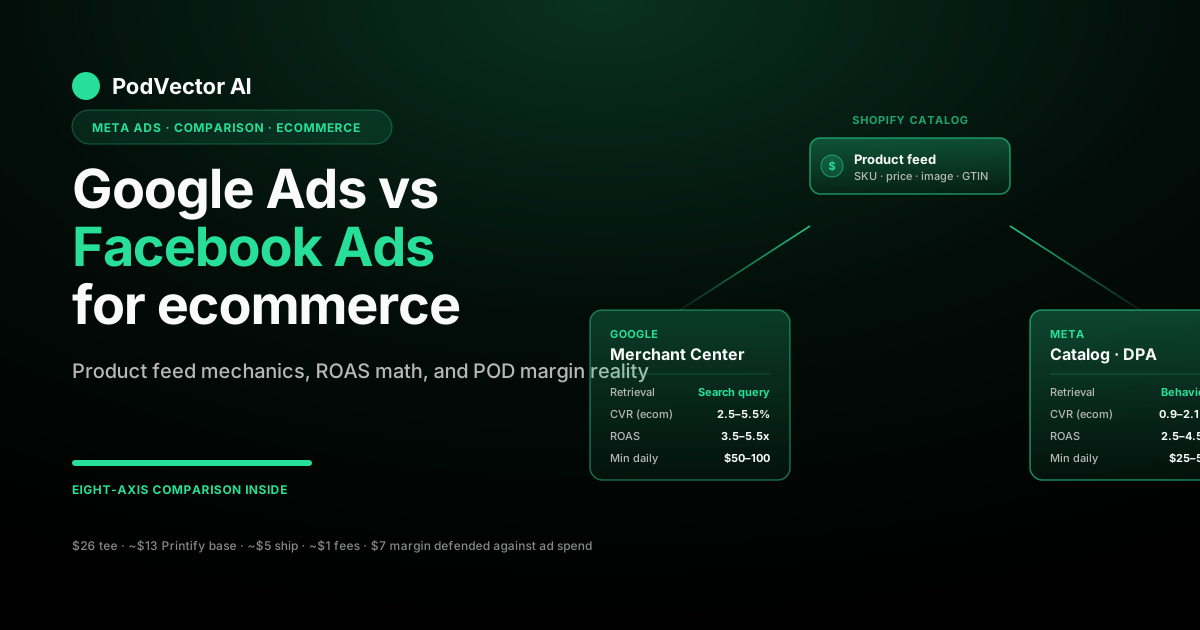
Quick Answer: For ecommerce specifically, Google Ads vs Facebook Ads is really a question about two different infrastructure stacks: a product feed plus search bidding (Google Shopping) versus a product catalog plus algorithmic discovery (Facebook Dynamic Product Ads). Both consume the same Shopify catalog, but they monetize attention in opposite directions.
Google Shopping wins for ecommerce stores selling categories people actively search for — branded apparel, gift niches with named keywords, products with clear specs and competitive comparison shopping. Facebook Ads wins for visual or identity-driven products people don't know they want yet, which is most original print-on-demand designs.
This guide compares the two systems on the eight axes that actually matter for an ecommerce P&L — feed mechanics, conversion tracking, ROAS benchmarks, creative pipeline, Shopify integration depth — then layers POD's $5–9 contribution margin reality on top so you can pick correctly for your store this week.
Why "for ecommerce" changes the question
A general "Google vs Facebook Ads" comparison treats the two platforms as interchangeable demand sources. For ecommerce, they're not.
Ecommerce ads run on top of a product catalog. Both platforms ingest your product feed, render dynamic product cards from it, and tie performance back to specific SKUs in your store. Everything about ecommerce — the creative, the bidding, the reporting — depends on that feed plumbing working correctly.
Google Ads consumes the feed through Google Merchant Center and exposes it in Google Shopping ads, the product carousel on the search results page, and Performance Max product placements. Facebook Ads consumes the same feed through the Meta Catalog and exposes it in Dynamic Product Ads (DPAs), Advantage+ Shopping campaigns, and Instagram Shopping.
Both can also run non-ecommerce ad formats (Search text ads on Google, image and video brand ads on Facebook), but the ecommerce-specific question is which feed-driven system better matches how your customers actually buy.
For most established ecommerce categories — electronics, beauty, home goods, branded apparel — the answer leans Google Shopping because customers research with named keywords. For original POD designs, niche apparel, and identity-expressive merchandise, the answer leans Facebook because nobody Googles "ironic axolotl t-shirt" on purpose.
The rest of this guide compares the two systems specifically through that ecommerce lens, then overlays POD's tighter margin math at the end.
The eight-axis ecommerce comparison
Here is the at-a-glance comparison using axes that matter for an ecommerce store, not generic ad-platform marketing copy. Numbers are 2026 ecommerce-vertical ranges from public benchmark data and our own POD-operator client cohort.
| Axis | Google Ads (Shopping/PMax) | Facebook Ads (DPA/Advantage+) | Ecommerce verdict |
|---|---|---|---|
| Average CPC (ecommerce) | $0.85–$2.30 | $0.55–$1.45 | Facebook cheaper at the click |
| Average ROAS (ecommerce) | 3.5–5.5x | 2.5–4.5x | Google Shopping leads on intent |
| Conversion rate | 2.5–5.5% | 0.9–2.1% | Google's intent advantage |
| Catalog feed handling | Merchant Center, strict validation | Meta Catalog, looser validation | Tie — both work with Shopify |
| Creative burden | Low — feed images suffice | High — needs original ad creative | Google for catalog stores, Facebook for design stores |
| Demand-creation power | Weak (captures existing demand) | Strong (creates new demand) | Facebook for new niches |
| Min. efficient daily spend | $50–$100 | $25–$50 | Facebook lower starting floor |
| Attribution honesty | Last-click bias inflates Google | Pixel + CAPI helps but caps at 7-day click | Both flatter themselves |
Three things stand out from this table for ecommerce sellers specifically. First, Google's higher CPC is offset by a higher conversion rate, so the per-click cost difference shrinks at the per-customer level. Second, Facebook's lower starting floor matters when you're under $5K MRR and can't fund a $100/day Shopping floor. Third, both platforms over-credit themselves in their own dashboards. You need the real numbers pulled together in one place, not just what each ad platform says about itself — more on that below.
Product feed vs catalog: the core ecommerce mechanic
The single biggest difference between Google Ads and Facebook Ads for ecommerce is how they treat your product feed.
Google Merchant Center: strict validation, search-keyed retrieval
Google Merchant Center expects a tightly structured feed with mandatory fields like GTIN, brand, condition, availability, price, and product category. Shopify's native Google & YouTube channel pushes this feed automatically, but Merchant Center will disapprove products with missing GTINs, low-quality images, or descriptions that look spammy.
Once approved, your products are matched to user search queries through Google's product taxonomy and your title and description fields. The matching is keyword-keyed: a search for "graphic t-shirt skull" surfaces products whose titles or descriptions contain those tokens.
This is why product titles matter so much in Google Shopping. A title like "Anatomical Skull Graphic T-Shirt — Unisex Cotton Tee, S–3XL" outperforms "Cool Skull Tee" on the same product because it contains the exact tokens shoppers type.
Meta Catalog: looser validation, behavior-keyed retrieval
The Meta Catalog accepts the same Shopify feed (or pulls it directly via the Facebook & Instagram channel app), with looser field requirements. Missing GTINs don't disqualify products. Image quality is judged against ad-policy standards, not catalog-listing standards.
The key difference is retrieval. Facebook doesn't match products to search queries — there is no search query. Instead, the algorithm matches products to users based on past behavior: product views, add-to-carts, lookalike audiences, and pixel-derived interest signals.
This means product titles barely matter in DPA campaigns. What matters is the product image, the price, and whether a similar user already converted on a similar SKU.
What this means for your store
If you sell products people search for by name, Google's keyword-keyed retrieval is doing free work for you — every well-written product title is a potential ad headline. If you sell original designs nobody knows to search for, Google has nothing to match against, and Facebook's behavior-keyed retrieval is the only system that can find your buyers.
For POD specifically, this is the structural reason why most original-design stores see better results from Facebook DPAs than from Google Shopping. The audience for "chaos goblin energy mug" doesn't exist as a search query. It exists as a behavior pattern.
Search intent vs discovery: what your ecommerce traffic looks like
The intent vs interest framing shows up in every Google vs Facebook article, but ecommerce sellers should think about it specifically as traffic shape.
Google Shopping traffic
A Google Shopping click comes from someone who typed a product-relevant query into a search box. That person already knows what they want, often down to the SKU. Conversion rates are 2.5–5.5% on ecommerce because the qualification has already happened — Google just charges you to be the storefront they pick.
The downside: traffic volume is capped by search volume. If your niche has 1,200 monthly searches across all relevant queries, you can buy maybe 500 of those clicks per month before you saturate the auction. Past that point, more spend buys less efficient impressions in PMax's expanded inventory.
Facebook DPA traffic
A Facebook DPA impression comes from someone scrolling their feed, getting served your product because the algorithm thinks they look like past converters. They didn't ask to see it. Conversion rates are 0.9–2.1% on ecommerce because most of them don't actually want it.
The upside: traffic volume is uncapped. There are 3+ billion monthly active users across Meta's properties. If your unit economics work at 1.2% conversion, you can scale spend until creative fatigue or audience saturation, both of which take weeks to hit at typical POD spend levels.
Reading your store's traffic shape
Look at your top organic search queries in Search Console. If 20%+ of your traffic comes from product-name or product-category queries (not your brand name), Google Shopping has structural fit. If your organic search traffic is mostly brand defense and the rest of your traffic comes from social, email, or direct, Facebook is your demand engine.
For a deeper version of this analysis tied specifically to POD economics, see our guide to Google vs Facebook Ads for POD sellers, which decomposes "Google" into the five separate ad products that matter.
Cost and ROAS benchmarks for ecommerce
Ecommerce-specific 2026 benchmarks across our client cohort and triangulated against Triple Whale and Shopify reports:
- Google Shopping ecommerce CPC: $0.85–$2.30 in apparel, higher in finance/insurance verticals (irrelevant to POD)
- Google Shopping ecommerce ROAS: 3.5–5.5x first-touch, ~3.0x once you de-duplicate with Facebook overlap
- Facebook ecommerce CPC: $0.55–$1.45 across apparel and accessories
- Facebook Advantage+ ROAS: 2.5–4.5x reported, ~2.2x once you account for view-through over-credit
- Combined platforms ROAS: 2.8–4.0x blended is realistic for stable ecommerce stores running both
Two ecommerce-specific cost truths most articles skip. First, Google Shopping CPC rises non-linearly with spend because PMax expands into less qualified inventory once you exhaust pure Shopping demand — your reported ROAS will look great at $30/day and will collapse at $300/day if your niche only has $50/day worth of real intent.
Second, Facebook's reported ROAS includes 1-day view-through attribution by default, which over-credits the platform for purchases that would have happened anyway. Switching the attribution window to 7-day click in Ads Manager will drop your reported ROAS by 25–40% but show you the number that actually correlates with revenue.
For the cost-only deep-dive, see our cost-focused comparison of Google Ads vs Facebook Ads with itemized POD margin math.
Tracking and attribution: pixel, CAPI, Enhanced Conversions
Ecommerce stores live or die on attribution. Both platforms have rebuilt their tracking stacks in response to iOS 14, third-party cookie deprecation, and GA4's session-based model.
Facebook side: Pixel + Conversions API (CAPI)
The Meta Pixel handles browser-side events. The Conversions API (CAPI — Meta's server-side event-forwarding system that complements the browser pixel) handles server-side events that survive ad-blockers and iOS limitations. Shopify's native Facebook channel handles both, but the CAPI implementation is partial — for full event coverage you typically need Stape, Elevar, or a custom server-side tagger.
Match quality (Meta's score for how well your events tie to known users) is the metric that matters. Below 7.0, your CAPI is leaking signal. Above 8.0, you're getting most of what's available.
Google side: Enhanced Conversions + Google Tag
Enhanced Conversions sends hashed first-party data (email, phone, address) alongside conversion events to improve attribution accuracy. Combined with Google's first-party Tag (gtag) and Google Analytics 4 conversion forwarding, this is the best server-to-server signal Google offers ecommerce stores.
The trade-off is that Google's attribution model defaults to "data-driven attribution" (DDA — Google's machine-learning attribution that distributes credit across the touchpoints it can see), which over-weights Google's own touchpoints because that's the data Google has.
The truth both platforms hide
If you sum Facebook's reported revenue and Google's reported revenue for the same period, the total typically exceeds your actual Shopify revenue by 40–80%. Both platforms claim credit for the same conversions.
The only honest way to resolve this is to feed both platforms' raw conversion data into a single source of truth and run a cross-platform attribution model on the unified record. That's what serious ecommerce operators do once they cross $50K/month in ad spend, and it's what our agent Victor is built around.
For the deep dive on Meta-specific attribution, see our complete guide to Meta Ads ROAS and attribution for POD.
Shopify integration depth on each platform
Both platforms integrate with Shopify, but the depth of the integration differs.
Google & YouTube channel app
Free Shopify-built app. Auto-syncs your product feed to Google Merchant Center, handles Performance Max campaign creation, configures Enhanced Conversions, and forwards purchase events. Coverage is good for Shopping and PMax; weaker for Search and YouTube.
Setup time: 30–60 minutes. Approval time for Merchant Center: 24–72 hours, longer if you have GTIN issues.
Facebook & Instagram channel app
Free Shopify-built app. Auto-syncs catalog to Meta Catalog, installs Pixel, handles partial CAPI through Shopify's first-party event tracking, configures Instagram Shopping. Coverage is good for DPAs and Advantage+; weaker for full-funnel measurement without a third-party tagger.
Setup time: 20–40 minutes. Approval time: same-day for the catalog, longer if your domain or business hasn't been verified.
For the complete Meta-specific Shopify setup, see our guide to Meta Ads Shopify integration for POD, which covers Pixel, CAPI, catalog, and Instagram Shopping in detail.
Where both fall short for POD
Neither integration knows your supplier costs. Shopify only sees the price the customer paid, not what Printify or Printful charged you. Both platforms therefore optimize toward revenue, not toward margin.
For a $26 hoodie with $14 cost of goods and $5.50 shipping, a campaign optimized to "purchase" can run at 3.0x reported ROAS while losing money once you net out supplier cost. Margin-aware optimization requires sending an enriched event with your contribution-margin number, which neither stock integration does.
The POD overlay: where ecommerce comparisons break
Most "Google Ads vs Facebook Ads for ecommerce" articles assume your contribution margin sits between 50% and 75%. For print-on-demand, it doesn't.
The POD margin reality
A $26 unisex t-shirt sold through Printify carries roughly $11–13 in Printify base cost, $4.50–5.50 in shipping, and $1.20 in Shopify platform fees. Contribution margin is $5.50–9.30 before any ad spend.
That changes the maximum tolerable customer acquisition cost (CAC). A generic ecommerce store with $13 contribution margin on a $26 sale can afford $7–8 in CAC and still hit a 1.6x first-order MER (marketing efficiency ratio — total revenue divided by total ad spend, the cleanest cross-platform measure of ad-efficient growth). A POD store with $7 contribution on the same sale can afford $3.50 max.
What this does to the comparison
At a $0.85–$2.30 Google Shopping CPC and a 3.5% conversion rate, you're paying $24–66 for a customer. That's lethal at POD margins unless your average order value (AOV) is well above $40 and you have repeat-purchase mechanics in place.
At a $0.55–$1.45 Facebook CPC and a 1.5% conversion rate, you're paying $37–97 for a customer at the same single-order math, which sounds even worse. The reason Facebook still wins for most POD operators is multi-purchase: a Facebook-acquired POD customer typically buys 1.4–1.8 items per order at higher AOV (driven by collection ads and DPA cross-sells), while Google Shopping customers tend to buy the single SKU they searched for.
The Printify vs Printful supplier-cost wrinkle
Printify routes you to whichever provider has the cheapest base cost for a given garment, which means your cost of goods varies by SKU within the same campaign. Printful uses a single in-house production network with consistent base costs, slightly higher but more predictable.
The implication for ad math is that Printify-based stores need per-SKU margin tracking to know which products are actually profitable to advertise — a $26 tee from one Printify provider can carry $11 cost while the same tee from another provider carries $14. Printful-based stores can use category-level margin numbers without losing accuracy.
Neither Google Ads nor Facebook Ads knows this on their own. The fix is to connect your real supplier cost from Printify or Printful to each sale, so you can judge your ads by margin, not just revenue. Building this yourself takes custom work for most stores. Victor does this for you automatically.
Running both: the full-funnel ecommerce framework
Once you cross roughly $5K MRR and have a clean attribution stack, the right answer for ecommerce stops being "pick one" and starts being "run both at the right ratio."
The 70/30 starting split for POD
For most POD stores under $50K/month revenue, start with 70% of ad budget on Facebook and 30% on Google. Facebook does the demand creation, Google captures the searches that demand creation generates (including branded search defense — buying your own brand name to keep competitors off the SERP).
The shift trigger
Watch the share of revenue coming from organic search vs paid social. When organic search exceeds 25% of total revenue, your niche has matured into searchable demand and you can shift the ratio toward 50/50 — Google Shopping starts pulling its weight because there's now real intent traffic to capture.
De-duplicating attribution
Both platforms will claim 100% credit for the same conversion when run together. Someone has to sort out which platform really earned credit for each sale. Victor does this for you: he checks both platforms' results against your actual Shopify orders and splits the credit between them fairly.
For a deeper view of how this multi-channel framing applies across all of Meta vs other ad channels for POD, see our Meta Ads vs alternatives complete comparison for POD.
Which one to pick for your store
If you can only run one platform, here's the decision rule for ecommerce sellers, with POD-specific weighting.
Run Google Shopping first if:
- Your niche has 5,000+ monthly searches across product-relevant queries
- Your products have clear, named identities (graphic styles people search by name, licensed designs in genres with search volume, branded merchandise)
- Your AOV is above $35 and you have repeat-purchase mechanics
- You can fund a $50–100/day Shopping floor for 3–4 weeks of learning
Run Facebook Ads first if:
- Your designs are original and lack named search demand
- You have a creative pipeline that can produce 8–15 fresh ad variants per week
- Your AOV is below $35 and you depend on multi-item carts for unit economics
- You're under $5K MRR and need a $25–50/day starting floor
Run both if:
- You're above $10K/month in revenue with stable creative and a working pixel/CAPI
- Your warehouse can de-duplicate attribution across platforms
- You're optimizing for blended MER, not platform-reported ROAS
For the complete cluster context on these comparisons, the Meta Ads comparison cluster hub has the full set of Meta vs alternative breakdowns, and the Meta Ads topic hub covers strategy, attribution, integrations, and ad types in depth.
Mistakes ecommerce sellers make in this comparison
1. Comparing CPC instead of CAC
Facebook's lower CPC looks like a win until you adjust for conversion rate. The cleaner number is cost per acquired customer (CAC = ad spend ÷ unique purchasers), which closes the gap considerably and is what your P&L actually defends.
2. Trusting platform-reported ROAS
Facebook reports include view-through credit, which inflates by 25–40%. Google's data-driven attribution over-weights Google touchpoints. The honest number comes from looking at your real orders, not either platform's own dashboard — and that's what Victor shows you.
3. Optimizing on revenue when POD requires optimizing on margin
A campaign at 3.0x reported ROAS can lose money when supplier cost is netted out. Margin-aware optimization is the only move at POD margins. Build it server-side or use an agent that builds it for you.
4. Funding Google Shopping below the learning threshold
Shopping's smart bidding needs roughly 50 conversions in 30 days to learn. At a 3.5% conversion rate and $1.50 CPC, that's about $1,300/month minimum to give the algorithm enough signal to converge. Below that, you're paying for unconverged learning forever.
5. Comparing Google PMax to Facebook Advantage+ as if they're equivalent
They're not. PMax expands into Display, YouTube, and Gmail inventory that has nothing to do with Shopping intent. Advantage+ stays within Meta's feed and Reels placements where the catalog actually performs. Comparing the two as "automated all-in-one campaigns" hides a 2–3x difference in placement quality for ecommerce.
FAQs
Is Google Ads or Facebook Ads better for a Shopify store?
It depends on your traffic shape. Stores with 25%+ of revenue from non-branded organic search have searchable demand — Google Shopping captures it efficiently. Stores whose discovery happens on social or email — most original-design POD stores — get more from Facebook DPAs.
Which has better Shopify integration?
Both have Shopify-built channel apps that handle catalog sync, conversion tracking, and basic campaign creation. Facebook's Pixel + CAPI integration is slightly more capable out of the box; Google's Merchant Center + Enhanced Conversions is slightly stricter but cleaner. For full-fidelity tracking on either, you'll want a third-party server-side tagger like Stape or Elevar once you're past $20K/month in ad spend.
What's the minimum daily budget to compare them honestly?
$25–50/day on Facebook for 3 weeks (about 30–50 conversions of learning data) and $50–100/day on Google Shopping for 4 weeks (about 50 conversions). Below those thresholds, neither algorithm has converged and the comparison is noise.
Do I need both for ecommerce?
Not under $5K MRR. Pick one based on traffic shape and fund it properly. Past $10K MRR with stable creative and a working pixel/CAPI, running both at a 70/30 or 60/40 split (Facebook lead) typically beats either alone on blended MER.
How do POD margins change the answer?
POD's $5–9 contribution margin per shirt makes Google Shopping's $24–66 cost-per-customer math hard to defend on single-order economics. Facebook's lower starting floor and cross-sell-friendly DPA format produce more multi-item orders, which is what saves the math at POD margins. Run Facebook first, add Google once your AOV crosses $35.
What about Performance Max vs Advantage+ Shopping?
PMax expands into placements (Display, YouTube, Gmail) that don't perform like Shopping. Advantage+ stays within Meta's feed/Reels inventory. For ecommerce specifically, comparing the two as equivalents is a category error — Advantage+ is closer in spirit to Google Shopping than to PMax.
How do I attribute revenue when running both?
Both platforms claim credit for the same orders, so summed dashboard revenue exceeds Shopify revenue by 40–80%. The only honest fix is to match both platforms' results against your real Shopify orders and split the credit between them fairly. Shopify's own breakdown covers the basics; Victor handles this part for you by default.
Stop guessing which platform is winning
Both Google and Facebook will tell you they earned the conversion. Neither will tell you what your real margin per channel was after Printify or Printful supplier costs.
Victor unifies your Shopify orders, Printify and Printful supplier costs, Google Ads spend, and Facebook Ads spend, then answers "where should my next ad dollar go?" with the actual margin-weighted number, not the inflated platform-reported one.
POD operators using Victor see margin-aware bidding catch losing campaigns 2–3 weeks earlier than dashboard-only operators.
Try Victor free