
Most explanations of the contribution margin equation stop at "revenue minus variable costs" and a tidy t-shirt example. That's correct, but it hides the part that actually decides whether you make money: which costs count as variable, and what's left after you subtract all of them. This guide walks a real per-order calculation, in layers, so you can see profit appear (or disappear) line by line.
The contribution margin equation, three ways
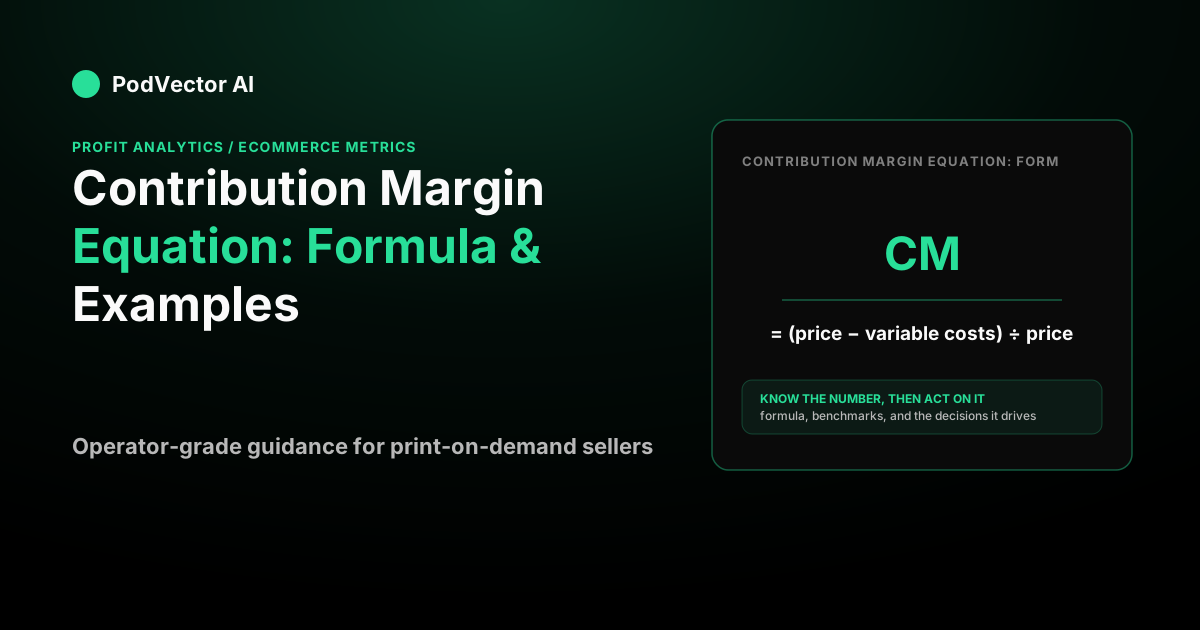
The equation shows up in three interchangeable forms. Pick the one that matches the decision you're making.
- Total contribution margin:
Revenue − Total Variable Costs. Use this for a whole product line or a month. - Per-unit contribution margin:
Price − Variable Cost per Unit. Use this to price a single product or compare SKUs. - Contribution margin ratio:
(Revenue − Variable Costs) ÷ Revenue × 100. Use this to compare products of different prices on equal footing, and to find break-even.
All three describe the same gap between what you charge and what each sale costs you to deliver. The ratio is just the per-unit figure expressed as a share of price. For a deeper treatment of the percentage form, see our guide to the contribution margin percentage.
What counts as a variable cost
The formula is trivial. The judgment call is what goes into "variable costs." A cost is variable if it moves with volume — one more order creates one more unit of it. The usual suspects:
- COGS — the product itself (for print-on-demand: the blank, the print, and the supplier's base fulfillment charge).
- Outbound shipping you pay the carrier or pass to your fulfiller.
- Payment processing fees (a percentage of each order).
- Pick/pack labor that scales per order.
- Allocated ad spend, if you're measuring contribution after acquisition.
Fixed costs — rent, salaries, software subscriptions, a base agency retainer — are deliberately left out, because they don't change when you sell one more shirt. That exclusion is the whole point: contribution margin isolates the profitability of the next sale from the overhead you'd pay anyway.
It's a common mistake to treat shipping and transaction fees as fixed or to lump them into "other expenses." As Xero notes, contribution margin covers "all variable costs, including COGS, marketing, and sales commissions" — not just the cost of goods. That distinction is where print-on-demand sellers most often misread their margins. For context on what Printful shipping actually costs per order, see our breakdown of why Printful shipping is so expensive.
Contribution margin vs. gross margin: the key difference
These two metrics are frequently conflated, and the confusion is expensive. According to Wayflyer's 2026 ecommerce guide, typical ecommerce gross margins run in the 55–70% range, while contribution margins after ad spend typically land in the 20–35% range — the same store, the same orders, a very different number depending on which costs you include.
| Metric | Costs subtracted | Best used for |
|---|---|---|
| Gross margin | COGS only (materials, print, base fulfillment) | Evaluating supplier pricing and product viability |
| Contribution margin (CM2) | COGS + shipping + transaction fees + fulfillment labor | True per-sale profitability before acquisition spend |
| Contribution margin after ads (CM3) | All of the above + allocated ad spend | Channel-level break-even and ROAS decisions |
| Net margin | Everything, including fixed costs | Company-wide scorecard |
Worked example: one print-on-demand order
Say you run a print-on-demand apparel store and want the contribution margin on one average order. Frame the numbers as your inputs, then let the arithmetic do the work.
Say your average order is priced at $40. Here's the full per-order stack.
Layer 1 — gross profit (after COGS only)
Subtract just the cost of goods. Say the blank garment, print, and base fulfillment cost total $16 per order.
$40 − $16 = $24 gross profit, a gross margin of $24 ÷ $40 = 60%.
Gross profit answers "is this product worth making?" — but it's optimistic, because it ignores every other cost of getting the order out the door.
Layer 2 — contribution margin before ads (CM2)
Now subtract the rest of the variable costs that aren't COGS. Say shipping runs $5, payment processing is 4% of the $40 order ($1.60), and pick/pack labor is $1.40.
$24 − $5 − $1.60 − $1.40 = $16
That $16 is your contribution margin before advertising — often written CM2. As a ratio: $16 ÷ $40 = 40%. Notice a 60% gross margin already fell to a 40% contribution margin, and you haven't spent a dollar on marketing yet.
Layer 3 — contribution margin after ads (CM3)
Advertising is variable too — you spend more to sell more — so a full picture nets it out. Say you run ads and allocate $10 of ad spend to a $40 order (a 4.0 return on ad spend on that order).
$16 − $10 = $6
That final $6 is CM3: contribution margin after ads, a ratio of $6 ÷ $40 = 15%. This is the number that survives to cover rent, salaries, and software. The tidy 60% margin you started with is really 15% once every variable cost is honest.
This layered view is exactly the kind of true per-order profit that gets buried when you only look at revenue and gross margin. It's also why two stores with the same "60% gross margin" can have wildly different bank balances. If you're running Meta campaigns, our guide to Meta Ads ROAS for POD sellers shows how to tie your ROAS target back to your CM3 floor.
Turning the equation into a ratio (and why the ratio is the useful part)
The contribution margin ratio strips out price so you can compare products fairly. A $40 order at $16 CM2 and a $20 order at $8 CM2 both have a 40% ratio — same efficiency per dollar of revenue, different absolute dollars.
CM ratio = Contribution Margin ÷ Revenue × 100
Using the CM2 figure above: $16 ÷ $40 × 100 = 40%.
The ratio is what feeds break-even and target-ROAS math, so it's worth computing per SKU. High-price, low-margin products and low-price, high-margin products can look identical in gross terms and diverge sharply once you rank them by contribution ratio. For POD sellers deciding between Printify's Bella+Canvas 3001 at different price tiers, our Printify Bella+Canvas 3001 price breakdown gives you the cost inputs to run this math on a specific blank.
What the equation unlocks: break-even
Contribution margin exists to answer one question: how much do you need to sell before fixed costs are covered and profit begins?
Break-even units = Fixed Costs ÷ Contribution Margin per Unit
Say your fixed costs are $4,000 a month. Using the CM3 figure of $6 per order:
$4,000 ÷ $6 = 667 orders per month
In revenue terms, divide fixed costs by the ratio instead: $4,000 ÷ 0.15 = $26,667. Below that, you're funding the business out of pocket; above it, each additional $6 of contribution is profit.
The same logic drives break-even ROAS — the return on ad spend at which ad-driven sales exactly cover their own costs. It equals 1 ÷ contribution margin ratio. On the 40% CM2 base, that's 1 ÷ 0.40 = 2.5: any campaign under a 2.5 ROAS loses money before overhead, no matter how good the click-through looks. If you're tuning acquisition efficiency, our guide to Google Ads strategy for print-on-demand walks through how to anchor bid targets to this break-even number.
How to use contribution margin to price products
Break-even analysis runs backward as well as forward. If you know your fixed costs and your target units, you can solve for the minimum price that makes each order viable.
- Start with your variable cost stack. Add COGS, shipping, transaction fees, and fulfillment labor for the SKU in question.
- Add your required contribution per unit. Divide your monthly fixed costs by your target order volume to find how much each sale must contribute.
- Set price = variable cost + required contribution. That floor is your minimum viable price before any profit margin.
- Layer in your ad spend target. If you plan to run paid traffic, add the ad spend per order (at your target ROAS) to find the CM3-aware price floor.
This is the same math that drives dynamic repricing decisions. If a SKU's current price doesn't clear its CM3 floor, either the price needs to go up or the cost inputs need to come down — and that's a testable, fixable problem, not a vague "margin issue." For POD sellers using Printful, keeping an eye on Printful Premium membership pricing can shift your COGS input and change the floor entirely.
Contribution margin for multi-SKU and multi-channel stores
Single-product examples are pedagogically clean but operationally rare. Most POD stores run dozens of SKUs across organic, Meta, and Google channels simultaneously — which means contribution margin analysis needs to happen at multiple levels:
- Per-SKU CM2 ranks which products are worth keeping without regard to how you acquired the customer.
- Per-channel CM3 ranks which acquisition channels are worth scaling — Meta organic, Meta paid, Google Shopping, email — each with its own effective ad spend per order.
- Blended CM across the store is what hits your bank account and funds fixed costs.
The trap is optimizing one layer while ignoring the others. A SKU with a great CM2 sold through a high-CPC Google campaign can have a terrible CM3. A low-CM2 SKU sold entirely through organic can be your most profitable revenue. Both look fine (or both look bad) if you only check one layer. For a broader view of where contribution margin sits in the full ecommerce metric stack, start with our ecommerce metrics guide.
From formula to live numbers
The equation is easy; keeping the inputs current is the hard part. Payment fees, carrier rates, supplier costs, and ad spend all drift, and a contribution margin built on last quarter's numbers quietly lies to you. That's the gap PodVector closes.
PodVector connects Shopify, Meta Ads, Google Ads, Printify, and Printful into a live data warehouse, then computes true per-order profit — the CM2 and CM3 layers above, calculated from your live order data instead of a spreadsheet estimate. Victor, PodVector's AI employee, reads that data across all six connected platforms and can act on it Shopify-side with your approval: repricing your worst-margin SKUs to a target margin, raising your free-shipping threshold, or bulk-updating prices. He reads your ad performance on Meta and Google and proposes moves — but ad-platform writes wait on you. If you want the contribution margin equation running on real orders instead of assumptions, start with PodVector.
For a look at how Victor's AI-driven analysis compares to building your own spreadsheet workflow, see our POD seller's guide to AI for Shopify stores.
FAQs
What is the contribution margin equation in simple terms?
It's revenue minus variable costs. For one sale: the price minus everything that costs you money because that sale happened — product, shipping, payment fees, fulfillment, and allocated ad spend. Whatever remains contributes to fixed costs and profit.
Is contribution margin the same as gross profit?
No. Gross profit subtracts only the cost of goods sold. Contribution margin subtracts all variable costs, so it's usually lower. In the example above, a $24 gross profit (60%) becomes a $16 contribution margin before ads (40%) and just $6 after ads (15%) — same order, three very different numbers.
Should ad spend be included in the contribution margin equation?
It depends on the decision. To judge whether a product is intrinsically profitable, use contribution margin before ads (CM2). To judge whether a specific acquisition channel pays, subtract the ad spend allocated to those sales and use contribution margin after ads (CM3). Just label which one you're quoting, because they can differ dramatically.
How do I calculate the contribution margin ratio?
Divide contribution margin by revenue and multiply by one hundred: (Revenue − Variable Costs) ÷ Revenue × 100. Using $16 of contribution margin on a $40 order gives $16 ÷ $40 × 100 = 40%. The ratio lets you compare products at different price points on equal footing.
What's a good contribution margin for ecommerce?
It varies by channel mix and fixed-cost load. According to Wayflyer's 2026 ecommerce guide, contribution margins after ad spend typically fall in the 20–35% range for ecommerce businesses. The practical test is break-even: your contribution margin has to clear a break-even ROAS of 1 ÷ ratio on paid channels, and your total contribution must exceed fixed costs before any profit exists. A ratio that looks healthy on paper but can't cover acquisition still loses money.
Why is my contribution margin so much lower than my gross margin?
Because gross margin ignores shipping, payment processing, fulfillment labor, and advertising — all of which are variable and all of which hit every order. A 60% gross margin routinely lands in the teens once those are subtracted. That gap is the single most common reason a "profitable-looking" store isn't.
Can I use contribution margin to set a minimum price?
Yes — this is one of its most practical uses. Work backward from your required contribution per unit (fixed costs ÷ target orders) and add it to your full variable cost stack. The result is your minimum viable price. Factor in your target ad spend per order at your desired ROAS to get a CM3-aware price floor that holds even after paid acquisition.
What happens to contribution margin during peak seasons?
Variable costs often spike during peak periods — carrier surcharges, expedited fulfillment fees, and higher CPMs on paid channels all compress contribution margin even as revenue rises. Checking your CM2 and CM3 weekly during Q4 (rather than relying on a quarterly average) prevents the common trap of hitting record revenue while actually earning less per order. Our guide to Printful holiday shipping deadlines, times, and costs covers the carrier-side cost shifts to budget for.