
What a CPM calculator does
CPM stands for "cost per mille," where mille is Latin for thousand. As Adjust explains, CPM is a pricing model where advertisers pay a fixed rate for every one thousand times their ad is displayed to users — you're paying for reach rather than results, whether the channel is digital, television, radio, or podcast.
A CPM calculator just rearranges a single equation. Give it two of the three inputs — cost, impressions, or the CPM rate — and it returns the missing one. That makes it handy for three jobs: pricing a media buy, estimating reach from a fixed budget, and comparing what different platforms charge for the same eyeballs.
Most calculators stop there. This guide runs the same math, then goes one step further into the number that actually decides whether a campaign is worth running: profit.
The CPM formula (and its two rearrangements)
The core formula is simple:
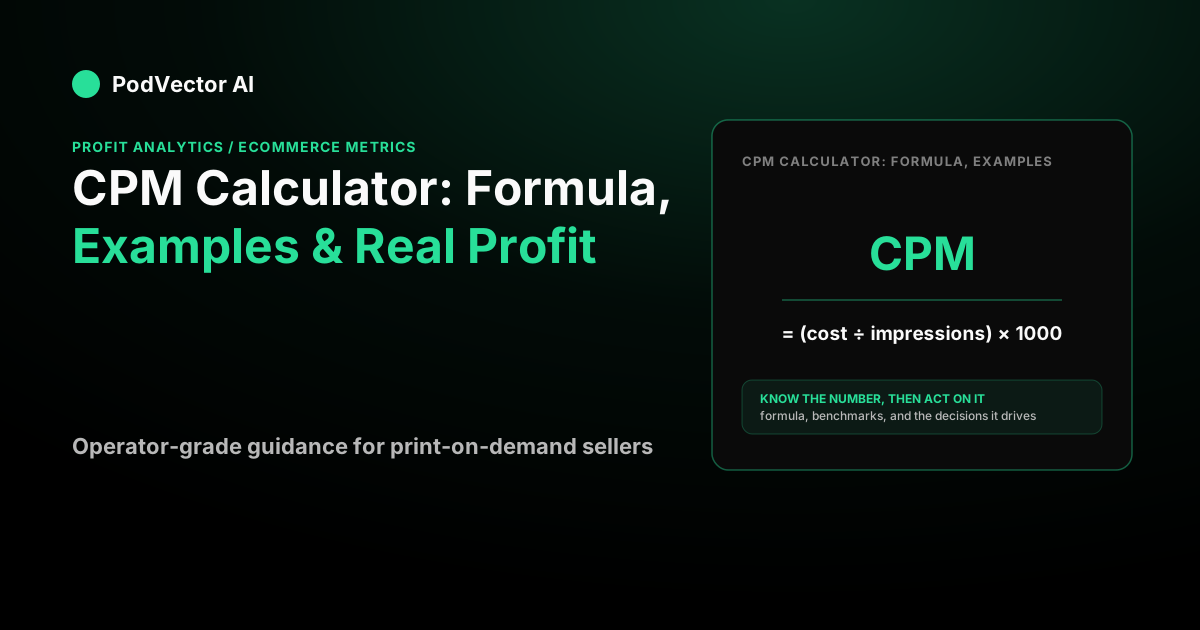
CPM = (Ad spend ÷ Impressions) × 1,000
Because it's a single relationship between three variables, you can solve for whichever one you're missing:
- Solve for cost:
Ad spend = (CPM × Impressions) ÷ 1,000 - Solve for impressions:
Impressions = (Ad spend ÷ CPM) × 1,000
That's the whole engine behind every CPM calculator on the web. Everything else is presentation.
How to calculate CPM step by step
If you prefer to skip a calculator and work the numbers by hand, the process has four steps, as outlined by calculatethecpm.com:
- Determine total ad spend. Identify the total spend for the campaign or placement — include ad spend only, not creative production costs.
- Count impressions. Pull the total number of times the ad was shown from your platform dashboard (Meta Ads Manager, Google Ads, etc.).
- Apply the formula. Divide total cost by impressions, then multiply by 1,000.
- Compare against industry benchmarks. Use your CPM to sense-check efficiency across campaigns and channels — but judge it by what it produces downstream, not the raw number alone.
The result is your CPM. Since CPM is measured per thousand impressions, multiplying by 1,000 standardizes the calculation so you can compare campaigns of any size on equal footing.
Worked example: pricing a campaign from a budget
Say you're planning a Meta campaign with a $2,000 budget, and the platform is quoting you a $10 CPM. How many impressions should you expect?
Impressions = ($2,000 ÷ $10) × 1,000 = 200,000 impressions
Now flip it. You know you need 500,000 impressions to hit a reach goal, and your negotiated CPM is $8. What's the spend?
Ad spend = ($8 × 500,000) ÷ 1,000 = $4,000
And to check a campaign after the fact: you spent $10,000 and the platform reported 1,000,000 impressions.
CPM = ($10,000 ÷ 1,000,000) × 1,000 = $10.00
Three inputs, one formula, three different questions answered. No calculator required once you see the shape.
Blended CPM across channels
If you run campaigns across multiple platforms simultaneously, avoid the temptation to average your CPMs directly — that can overweight small campaigns and distort the picture. As Northbeam notes, for blended campaigns you should calculate CPM per channel first, then compute a blended figure using total spend and total impressions across all channels for the same date range. Always ensure your cost and impression figures cover the same time window; mixing full-budget figures with partial delivery is a common source of nonsense CPMs.
Average CPM by platform
CPM rates swing hard by platform, format, audience, and season. The table below uses directional 2026 benchmark ranges drawn from publicly cited industry data — treat them as sanity-check reference points, not guaranteed rates.
| Platform / Format | Typical CPM range (2026) | Notes |
|---|---|---|
| Meta (Facebook + Instagram) | $8–$17 (avg. $14.19 per get-ryze.ai, 2026) | Conversion objectives run higher; awareness lower. CPM rose ~20% YoY per get-ryze.ai. |
| YouTube | $9–$16 skippable in-stream; Shorts ~$5 (per Understory / Digital Applied Q1 2026) | Niche and format drive wide variation; finance content can exceed $36. |
| Google Display Network | ~$3–$8 (per Understory / Digital Applied Q1 2026) | Cheapest major inventory; downstream quality needs close scrutiny. |
| $20–$45 (per thejonasagency.com, 2026) | Professional B2B targeting drives cost; highest among social platforms. | |
| TikTok | $4–$8 (per thejonasagency.com, 2026) | Low entry cost; intent variability makes CPA comparison harder. |
| ~$4.50 broad; $10–$12 B2B/SaaS (per Understory, 2026) | Between Display and Meta; directional ranges only. |
These figures are directional, not a quote — your own CPM depends on targeting tightness, competition in your niche, ad quality, campaign objective, and how narrow your audience is. Use benchmarks to spot outliers and sanity-check your account, not to forecast. The only CPM that matters for your P&L is the one your account actually delivers.
What counts as an impression?
This is a subtlety most CPM guides skip. An impression is counted every time an ad is displayed or shown to a user — but the definition varies by format and channel. On digital platforms, an impression is typically logged whenever an ad loads, regardless of whether it was actually seen. On out-of-home formats like billboards, impressions are measured using audited real-world traffic data and represent actual humans — they cannot be inflated by bots or blocked by ad-blocking software the way digital impressions can.
Why does this matter? Because comparing a social CPM to a streaming or billboard CPM without accounting for impression quality can lead to misleading conclusions. Always ensure your cost and impression figures cover the same time period and use the same counting methodology for accurate comparisons.
Why is my CPM high? Common causes
A rising CPM isn't always bad, but it's always worth diagnosing. According to benchmark data from calculatecpm.net (May 2026), several factors reliably push CPM above normal ranges:
- Audience too small. Audiences below roughly 500K give the auction fewer delivery alternatives, so the platform pays a premium to find your buyer.
- Low CTR. A CTR below 1% on awareness campaigns or below 0.5% on conversion campaigns signals poor creative relevance — platforms charge more to serve ads that users don't engage with.
- Saturated interest stacks. If your lookalike or interest targeting overlaps heavily with competing advertisers, auction pressure drives your CPM up.
- Too few conversion events. Fewer than roughly 10 conversion events per week gives the algorithm insufficient signal to optimize delivery efficiently.
- Peak-season competition. Q4 and major retail periods compress inventory and lift CPMs across the board.
CPM vs CPC vs CPA: which pricing model
CPM, CPC, and CPA answer different questions, and confusing them is a classic budgeting mistake.
- CPM — cost per thousand impressions. You pay for exposure. Good for awareness and reach.
- CPC — cost per click. You pay for traffic.
CPC = Ad spend ÷ Clicks. As Adjust notes, CPC offers a direct link between investment and specific user actions, making it ideal for campaigns focused on driving targeted interactions. - CPA — cost per action (a sale, lead, or signup). You pay for outcomes.
CPA = Ad spend ÷ Actions. This is the least risky model for advertisers — you pay only when a conversion actually occurs.
They're linked by a clean chain. If your $10 CPM buys 1,000 impressions and 2% of them click (a 2% CTR), you get 20 clicks — so your CPC is $10 ÷ 20 = $0.50. If 4% of those clicks convert, CPA = CPC ÷ conversion rate = $0.50 ÷ 0.04 = $12.50.
That chain is the point: a low CPM means nothing if the clicks don't convert. A cheap impression that never becomes a sale is still money spent. This is why CPM is a consideration-stage metric — useful for buying reach efficiently, useless for judging whether reach paid off.
What counts as a "good" CPM
Lower is not automatically better. A rock-bottom CPM often means you're reaching a broad, low-intent audience that never buys; a higher CPM against a tightly qualified audience can be the cheaper option per sale. As Understory's 2026 benchmark report puts it, "a cheap impression that misses your ICP is more expensive than a premium one that lands."
A "good" CPM is one where the downstream math works: the impressions convert to clicks, the clicks convert to orders, and the orders clear your costs with margin left over. Judge CPM by what it produces two and three steps down the funnel — alongside CTR, conversion rate, and ROAS — not in isolation. For POD sellers running Meta campaigns, our Meta Ads strategy guide for print-on-demand covers how to read CPM trends alongside ROAS to decide when to scale and when to pull back.
CPM and eCPM: what's the difference
CPM is the price you agree to pay per thousand impressions up front — it's a buying metric. eCPM ("effective CPM") is calculated after the fact: total earnings or cost divided by impressions, times 1,000. Publishers use eCPM to compare revenue across ad formats that were sold on different pricing models (CPM, CPC, CPA). Same formula shape, different vantage point. If you're an advertiser, CPM is what you pay; if you ever monetize ad space, eCPM is how you measure what you earned.
How to lower your CPM
If your CPM is genuinely too high for the reach you need, the levers are:
- Improve ad relevance and CTR. Platforms reward ads people engage with by charging less to show them. Better creative usually buys a lower CPM directly.
- Widen an over-narrow audience. Tiny audiences get expensive fast because you're competing hard for a small pool of impressions.
- Watch frequency. When the same people see your ad too many times, performance decays and effective cost climbs. Spot fatigue early before it inflates your real cost per result.
- Test placements and dayparting. Feed, Stories, Reels, and off-peak hours can carry very different CPMs for the same audience.
- Test ad formats. Video, carousel, and static image formats often carry meaningfully different CPMs on the same platform — test systematically rather than assuming one format dominates.
- Feed the algorithm more conversion signal. Campaigns receiving fewer than roughly 10 conversion events per week struggle to optimize delivery, which inflates CPM. Broadening your conversion event (e.g., Add to Cart before Purchase) can help.
For a deeper look at what drives ad efficiency for POD sellers, see our Quality Score formula guide — platform relevance scores directly affect the CPM you're charged.
The number every CPM calculator skips: profit
Here's the honest limitation of a CPM calculator, and every SERP result quietly steps around it: CPM measures cost, not value. As Omni Calculator puts it, CPM "is loosely tied to value, so advertisers can't be sure how much value they're getting."
So let's carry a CPM all the way to the bottom line. Say you sell a $40 product with a 60% gross margin, so each order carries $24 of gross profit. You run a campaign at a $10 CPM and buy 1,000,000 impressions for $10,000. A 2% CTR gives 20,000 clicks; a 4% conversion rate gives 800 orders.
Revenue is 800 × $40 = $32,000, so your ROAS looks like $32,000 ÷ $10,000 = 3.2 — a green number. But profit on ad spend (POAS) is what pays you: POAS = ROAS × margin ratio = 3.2 × 0.60 = 1.92. Gross profit is $32,000 × 0.60 = $19,200, minus the $10,000 spend, leaves $9,200 of ad-driven gross profit before shipping, fees, and fulfillment.
Now shift one input. If your margin were 25% instead of 60%, that same 3.2 ROAS gives POAS = 0.8 — a loss — even though the CPM and the ROAS never changed. The break-even ROAS is 1 ÷ margin ratio, so a 25% margin needs a 4.0 ROAS just to stop bleeding. That's the whole game, and it's invisible on a CPM calculator.
This is exactly why margin has to sit next to every ad metric. Our Google Ads attribution model guide and Google Ads attribution reports guide show how the attribution layer between CPM and reported ROAS can further obscure true profitability.
CPM for POD sellers: what makes it harder
For print-on-demand sellers on Shopify, CPM math has an extra layer of complexity: your true cost per order isn't fixed. Fulfillment costs vary by product, supplier, and shipping destination, which means the margin you'd use to convert ROAS into POAS can shift order by order. A campaign that looks profitable at an aggregate level can hide individual SKUs that are losing money on every sale.
This is compounded by the fact that Meta and Google only see revenue — they have no visibility into Printify or Printful fulfillment costs. So a "healthy" campaign ROAS may mask a product mix that's actually eroding margin. Understanding your per-product cost structure before scaling is essential. Our Google Ads Enhanced Conversions setup guide for POD sellers is a good starting point for ensuring your conversion data is as accurate as possible before you trust CPM-to-ROAS attribution on Google. And if you want to understand how platform fees compound the cost side, see what a chargeback fee is — unexpected chargebacks can silently erode the margin you thought you had.
Where PodVector fits
The reason ROAS reads as green while your bank account doesn't is that ad platforms only see revenue — they never see your COGS, shipping, fees, or fulfillment. PodVector connects Shopify, Meta Ads, Google Ads, Printify, and Printful into a live data warehouse, so a healthy-looking CPM and ROAS can be read as profit or loss rather than just a color on a screen.
Victor, PodVector's AI employee, reads that live data, analyzes which campaigns actually make money, and proposes moves — executing Shopify-side actions (repricing, discounts, collection management, and more) with your approval. Victor is not a dashboard, and he does not touch your ad account; he reads ad data and hands you the profit picture the CPM calculator can't.
For a deeper look at how the platform fits into a POD growth workflow, see the PodVector strategy overview. You can also explore how Victor's read surface covers AI-powered ecommerce analytics for POD sellers to understand what profit-side visibility actually looks like in practice. Ready to see per-order profit behind your own campaigns? Try PodVector.
FAQs
What is a good CPM?
There's no universal number — it depends on platform, audience, format, and campaign objective. As a rough 2026 orientation, Meta campaigns commonly run in the $8–$17 range, YouTube skippable in-stream around $9–$16, and Google Display around $3–$8, according to Understory's Q1 2026 benchmark data. A "good" CPM is really one whose impressions convert profitably downstream. Judge CPM by the orders and profit it generates, alongside CTR and conversion rate — not the impression price alone.
How do you calculate CPM by hand?
Divide your total ad spend by the number of impressions, then multiply by 1,000. For example, $500 spent on 100,000 impressions is ($500 ÷ 100,000) × 1,000 = $5.00 CPM. To find spend or impressions instead, rearrange the same formula: Ad spend = (CPM × Impressions) ÷ 1,000, or Impressions = (Ad spend ÷ CPM) × 1,000.
What's the difference between CPM and eCPM?
CPM is the price you agree to pay per thousand impressions up front. eCPM ("effective CPM") is calculated after the fact — total earnings or cost divided by impressions, times 1,000 — and is often used on the publisher side to compare revenue across ad formats that were sold on different models. Same formula shape, different vantage point.
Is a lower CPM always better?
No. A very low CPM often signals a broad, low-intent audience that rarely buys, so your cost per sale can end up higher. As benchmark data from calculatecpm.net notes, if your CPM is low but downstream outcomes are weak, you may simply be buying low-attention inventory. Judge CPM by the orders and profit it produces, not by the impression price alone.
Does CPM tell me if my ads are profitable?
No — that's its core limitation. CPM only measures the cost of reach. To know if a campaign makes money you need conversion rate, average order value, and margin, which together turn ROAS into profit on ad spend (POAS). A campaign can have a great CPM and still lose money on every order.
How does CPM work for POD sellers specifically?
The formula is identical, but the profit math is more complex: your fulfillment cost varies by product and supplier, so a campaign-level CPM or ROAS can mask wide variation at the SKU level. To evaluate whether a CPM-priced campaign is actually worth running, you need per-product margin data from Printify or Printful sitting next to your ad spend — something ad platforms alone can't give you.
Where do I pull impressions data to calculate CPM?
Pull your total spend and impression count from your ad platform dashboard — Meta Ads Manager for Facebook and Instagram campaigns, Google Ads for search and display, and so on. Most platforms also report CPM directly in their campaign summaries, so you can verify your hand calculation against the platform's own figure. For blended multi-channel campaigns, use total spend and total impressions across the same channels and the same date window, rather than averaging the per-channel CPMs directly.
Why is my CPM increasing?
CPMs have been rising across major platforms — according to get-ryze.ai's 2026 Meta benchmark data, average Meta CPM rose roughly 20% year-over-year. Common account-level causes include a too-narrow audience, low creative CTR, over-saturated interest targeting, too few weekly conversion events for the algorithm to optimize, and seasonal auction pressure during peak retail periods. Diagnose the specific lever before changing multiple variables at once.