
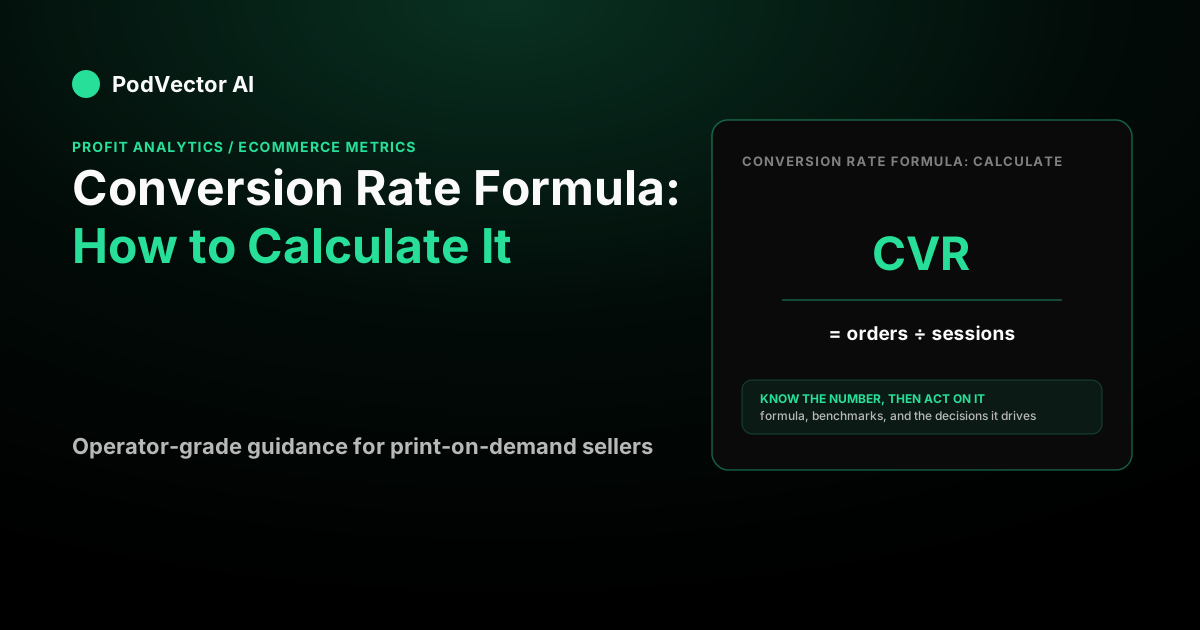
What is the conversion rate formula?
Conversion rate measures the share of visits that end in the action you care about. That action is usually a purchase, but it can be a signup, a lead, or an add-to-cart — you just have to name it before you calculate.
The formula is one line:
Conversion rate = Conversions ÷ Visits × 100
The multiply-by-100 step turns the raw ratio into a percentage, which is how everyone quotes it. Shopify defines the ecommerce version the same way — orders divided by visits to your website.
That is the whole formula. What makes conversion rate hard is not the arithmetic — it is deciding what goes in the numerator and, especially, what goes in the denominator.
How to calculate conversion rate: a worked example
Say you run a print-on-demand apparel store and want your on-site purchase conversion rate for last month. You pull two numbers from your analytics.
- Orders: 1,000
- Sessions: 40,000
Plug them in:
1,000 ÷ 40,000 = 0.025
0.025 × 100 = 2.5%
So 2.5% of visits produced an order. Read the other way, it took 40 sessions on average to generate one sale. That framing is useful because it puts a price on traffic: if you know what a session costs you to acquire, you now know roughly what a sale costs.
If you prefer, you can invert it. One order per 40 sessions means every extra 40 visitors is worth one more order at your average order value — a fast way to sanity-check whether a traffic push will pay off.
The denominator decides the number
Here is where most conversion rate mistakes live. "Visits" is not one thing, and each choice gives a different percentage from the exact same store.
- Per session (the ecommerce default): orders ÷ sessions. Our example gives 2.5%.
- Per unique visitor: orders ÷ unique visitors. If those 40,000 sessions came from roughly 20,000 people, the rate is 1,000 ÷ 20,000 = 5%. According to ConvertCart, using unique visitors as the denominator is best when you want to measure how well your personalization efforts are working for specific customer segments.
- Per ad click: orders ÷ ad clicks. If a campaign sent 20,000 link clicks that produced 800 orders, that is 800 ÷ 20,000 = 4%.
Same business, three legitimate numbers: 2.5%, 5%, and 4%. None is wrong, but they are not interchangeable. If you compare this month's per-session rate to last month's per-visitor rate, you will invent a trend that does not exist. Pick one denominator, write it down, and hold it constant.
Product-level conversion rate
Site-wide conversion rate is useful, but product-specific conversion rates add another layer of insight. According to InMotion Hosting, product conversion rate is calculated as: Number of purchases of a specific product ÷ Number of page views for that product × 100. If your best-selling tee drives far more conversions per page view than a slower design, you have a clear signal about where to focus your catalog and ad creative — an especially valuable lens for print-on-demand sellers managing large SKU counts. You can track these by using your analytics tool to compare sales against product page views for each item.
What counts as a good conversion rate?
There is no universal "good" number, because it swings hard by industry, traffic source, and price point. Global averages vary significantly depending on the source and methodology, which tells you how little a single benchmark is worth.
Industry matters far more than any global figure. Using Shopify's category benchmarks, food and beverage stores, beauty and personal care, and fashion and accessories each perform at different levels, while luxury and jewelry sit near the bottom of the range. A jewelry store and a snack brand can both be perfectly healthy for their respective categories while posting very different rates.
A more honest reference point than any average is your own trend. If your per-session rate is climbing month over month on a stable denominator and a stable traffic mix, that is the signal that counts. Chasing someone else's benchmark on a different traffic source is a good way to draw the wrong conclusion.
Conversion rate optimization (CRO): what it means
Conversion rate optimization (CRO) is the practice of improving your site and funnel so a larger share of existing visitors complete the action you want — without necessarily buying more traffic. As Wall Street Prep notes, "above-market conversion rates imply that the current marketing strategy is bringing in the right customers." CRO can include improving page speed, tightening product descriptions, simplifying checkout, adding trust signals, or running A/B tests on pricing. For POD sellers running Meta ads, pairing CRO work with A/B price testing is one of the highest-leverage combinations available because it attacks both the traffic cost and the on-site close rate at the same time.
The number the conversion rate formula hides: profit per session
Conversion rate on its own is a vanity trap. You can lift it by discounting into the ground and lose money on every extra order you win. The formula counts sales; it says nothing about whether those sales are worth having.
Two extensions fix that.
Revenue per session = conversion rate × average order value
Revenue per session tells you what an average visit is actually worth. It falls straight out of the conversion rate:
Revenue per session = Conversion rate × AOV
Say your per-session conversion rate is 2.5% and your average order value is $40. Then each session is worth 0.025 × $40 = $1.00.
This is why a conversion-rate win and an average-order-value win multiply rather than add. Nudge conversion from 2.5% to 3% and AOV from $40 to $44, and revenue per session goes from $1.00 to 0.03 × $44 = $1.32 — a 32% lift from two modest moves. Working on both at once is almost always the highest-leverage thing you can do.
The profit the formula never shows
Revenue per session still is not profit. Say that same $40 order carries product cost, shipping, payment fees, and pick-and-pack — leaving a contribution margin before ads. Now add ad spend. If you paid to acquire that order, the sale nets whatever is left before fixed costs.
That is the number a raw conversion rate hides completely. A campaign can push conversion rate up, look like a win in your reporting, and quietly lose money once product cost, fees, and ad spend are netted out. To connect conversion efficiency to what you actually keep, it helps to understand return on ad spend and its break-even point, and to check the operating margin left after all your costs.
Funnel conversion rates: where the drop-off actually happens
A single site-wide conversion rate is a blunt instrument. It tells you that visitors are leaving, not where. Breaking the funnel into stage rates points you at the leak. According to ConvertCart, the key funnel-stage formulas are:
- Add-to-cart rate = sessions with an add-to-cart ÷ total sessions × 100. Say 4,000 of 40,000 sessions add something to cart — that is 10%.
- Cart-to-checkout rate = checkouts initiated ÷ carts created × 100.
- Checkout completion rate = completed checkouts ÷ initiated checkouts × 100. Say 1,000 orders came from 1,600 started checkouts — that is 62.5%.
- Cart abandonment rate = 1 − (orders ÷ carts created), the complement of completion.
Abandonment is the stage most stores underestimate. The Baymard Institute puts the average documented cart abandonment rate at 70.22% across 50 studies. According to InMotion Hosting, the average cart abandonment rate across ecommerce is approximately 69.82% — consistent with Baymard's long-run figure. If roughly seven in ten filled carts never convert, the checkout — not the ad — is often the cheapest place to find growth. A one-point improvement in checkout completion flows straight through to your overall conversion rate at no extra traffic cost.
Conversion rate by device and traffic source
Blended site-wide rates can hide enormous variation by device and channel. Mobile visitors typically convert at a lower rate than desktop visitors on the same store, even when the traffic quality is comparable — which means a shift in device mix can move your headline number without any real change in your site's performance. Similarly, email traffic from a warm list converts at a fundamentally different rate than cold paid social traffic. Segmenting by device and source before drawing conclusions is not optional; it is basic hygiene. When you are diagnosing a conversion drop on a Meta campaign, it is also worth ruling out whether ad creative fatigue is weakening click quality before visitors even reach your store — a fatigued audience sends lower-intent clicks that depress conversion rate at the session level.
Common mistakes with the conversion rate formula
Mixing clicks and sessions. Ad platforms compute conversion on clicks; your analytics computes it on sessions. A single click can spawn several sessions, and a session can arrive with no tracked click. Dividing a platform's conversion count by your analytics sessions blends two different universes and produces a number that means nothing.
Counting "all clicks" instead of link clicks. Platforms report clicks that include likes, comments, and profile taps — far more than the link clicks that actually reach your site. Compute conversion off link clicks (or landing-page views), or you will understate the rate.
Averaging over a bimodal base. One conversion rate can hide two very different audiences — say a warm email list converting at a high rate and cold ads converting much lower. The blended average describes neither. Segment by source before you act on it.
Ignoring time period length. According to ConvertCart, you should track conversion rate over meaningful time periods — like a month or a quarter — so you can spot trends rather than getting thrown off by daily spikes or drops.
Reading conversion without profit. The biggest one. A rising conversion rate driven by a discount can shrink profit per order. Always pair the rate with revenue per session and contribution margin so you are optimizing for money, not motion. If your ad creative is wearing out and generating lower-quality clicks, your ad fatigue detection process should run before you blame your on-site conversion rate for a drop.
Where PodVector fits
Most of the pain above is that conversion rate lives in one tool and true cost lives in five others. PodVector connects Shopify, Meta Ads, Google Ads, Printify, and Printful, and computes the true per-order profit behind each sale — product cost, shipping, fees, and ad spend all netted out.
Victor, its AI employee, reads that live data and can act on it Shopify-side with your approval — the kind of move that turns a conversion number into a margin decision. Victor reads your Meta Ads and Google Ads data and proposes moves, but executes writes on Shopify only (ad platforms are read-only). If you want your conversion rate read next to the profit it produces, you can try PodVector.
FAQs
What is the conversion rate formula?
Conversion rate = conversions ÷ visits × 100. Count the actions you care about (usually orders), divide by the visits that could have produced them (usually sessions), and multiply by 100 for a percentage. Say a store has 1,000 orders from 40,000 sessions: 1,000 ÷ 40,000 × 100 = 2.5%.
How do I calculate ecommerce conversion rate specifically?
Use orders ÷ sessions × 100, which is the ecommerce default and matches how Shopify defines it. If you want acquisition efficiency instead, use orders ÷ ad clicks for a campaign. Just label which denominator you used, because per-session and per-click rates are different numbers from the same store.
What is a good conversion rate?
It depends entirely on your industry and traffic mix. Global averages vary widely depending on the source and methodology. Category benchmarks differ substantially — luxury and jewelry typically sit near the low end while food and beverage and beauty stores tend to be higher, per Shopify's data. Your own month-over-month trend on a fixed denominator is a more useful target than any single benchmark.
What is conversion rate optimization (CRO)?
CRO is the practice of increasing the share of existing visitors who complete a desired action — without necessarily increasing traffic. It covers page speed, UX improvements, checkout simplification, trust signals, and A/B testing. For POD sellers, CRO and price testing work well in combination because they attack both the traffic cost and the on-site close rate simultaneously.
Why did my conversion rate change when nothing else did?
Usually the denominator moved. Switching between sessions, unique visitors, and ad clicks — or a shift in traffic mix (more cold ad traffic converts lower than warm email traffic) — can swing the rate without any real change on-site. Standardize the denominator and segment by source before trusting the trend. If you run Meta ads, also check for ad fatigue in Meta ads, which degrades click quality and can depress conversion rate even when your site is unchanged.
Is a higher conversion rate always better?
No. You can raise conversion rate with discounts that shrink profit per order, so the sale wins but the business loses. Read conversion rate alongside revenue per session (conversion rate × average order value) and contribution margin so you are optimizing for money kept, not just orders counted.
What is the difference between conversion rate and cart abandonment rate?
Conversion rate measures the share of visits that convert; cart abandonment measures the share of filled carts that do not. They look at different funnel stages, so they are not exact complements. Cart abandonment averages about 70% across studies, according to the Baymard Institute, which is why fixing checkout is often cheaper than buying more traffic.
How does conversion rate connect to profit?
Through two steps. Conversion rate × average order value gives revenue per session, and revenue per session minus product cost, shipping, fees, and ad spend gives profit per session. A conversion rate on its own tells you nothing about whether the orders it counts actually made money.
How do ad fatigue and creative performance affect conversion rate?
When your ad creative wears out, the audience it reaches shifts toward lower-intent viewers who are less likely to buy. This sends lower-quality traffic to your store and depresses your session-level conversion rate even if your site itself is unchanged. Understanding ad fatigue in ecommerce is therefore part of diagnosing a conversion rate drop — not just your landing page or checkout flow. Reviewing ad fatigue statistics can help you set realistic benchmarks for when to rotate creative before conversion rate suffers.