
Most explanations of contribution margin percentage stop at the textbook formula and a tidy per-unit example. That is fine for an accounting exam. It is close to useless when you are running an ecommerce store and every order carries shipping, card fees, and pick-and-pack labor that the textbook quietly ignores.
This guide fixes that. You will get the exact formula, a worked example that nets out all the real variable costs an online order carries, and the one thing almost every article skips: how your contribution margin percentage sets the floor on how much you can spend to acquire a customer.
What is contribution margin percentage?
Contribution margin percentage (also called the contribution margin ratio) is the portion of your sales revenue that remains after you cover the costs that rise and fall with each sale. It is expressed as a percent of revenue.
The word "contribution" is literal. This is the money each sale contributes toward two things, in order: first your fixed costs — rent, salaries, software — and then, once those are covered, profit.
It is different from gross margin, and the difference matters. Gross margin subtracts only your cost of goods sold. Contribution margin subtracts every variable cost, which for an online order is a much longer list. A product can look healthy on gross margin and barely break even on contribution margin once shipping and fees are counted. If you want the full family of related numbers, our ecommerce metrics guide lays them out side by side.
The contribution margin percentage formula
There are two equivalent ways to write it.
At the whole-business or per-period level:
Contribution margin % = (Total revenue − Total variable costs) ÷ Total revenue × 100
At the per-unit level:
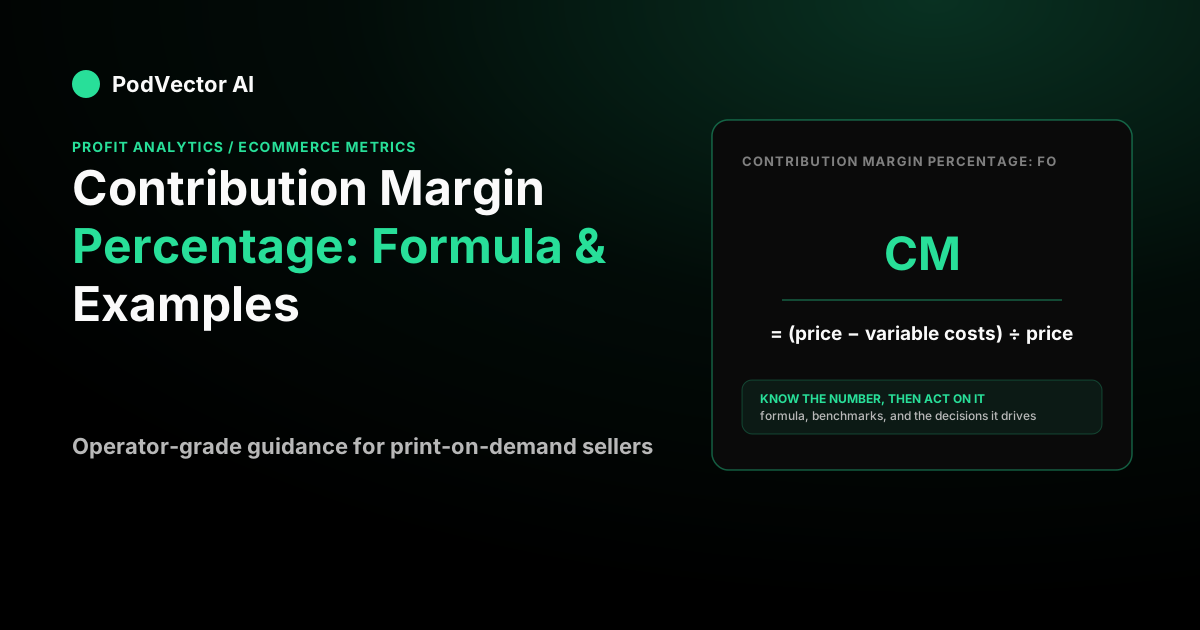
Contribution margin % = (Price − Variable cost per unit) ÷ Price × 100
Both give the same answer for a product with stable costs. The per-unit version is easier to reason about when you are pricing a single item; the total version is what you use to judge the whole store.
The only hard part is being honest about what belongs in "variable costs." A cost is variable if it appears because you made one more sale. That is the test. Ship one more order, and you pay for one more garment, one more shipping label, one more swipe fee. Your rent does not move.
A worked ecommerce example
Textbook examples subtract one cost and call it a day. Real orders are messier, so let's walk a real one.
Say you run a print-on-demand apparel store and your average order value is $40. Here is where the money goes on a typical order, before you touch fixed overhead:
- Revenue: $40.00
- Product cost — blank garment plus printing: −$16.00
- Shipping (what the carrier charges you): −$5.00
- Payment processing at four percent of the order: −$1.60
- Pick and pack labor: −$1.40
Add up the variable costs and you get $24.00 per order. So the contribution margin in dollars is $40.00 − $24.00 = $16.00.
Now convert to a percentage:
$16.00 ÷ $40.00 × 100 = 40%
That 40% is your contribution margin percentage. Out of every dollar this store rings up, forty cents is left to cover fixed costs and profit — before any advertising.
Notice how far that is from the gross margin. Gross margin here is ($40 − $16) ÷ $40 = 60%, because it only subtracts the product cost. The shipping, fees, and labor are what drag the honest number down to 40%. That twenty-point gap is exactly the trap in stopping at gross margin.
What happens after ad spend
Most stores acquire customers with paid ads, and ad spend is variable too — spend more, get more orders. Suppose you allocate $10.00 of advertising to that same order. Subtract it from the $16.00 you had left:
$16.00 − $10.00 = $6.00, which is $6.00 ÷ $40.00 = 15%.
So this store has three layers worth naming: a 60% gross margin, a 40% contribution margin before ads, and a 15% contribution margin after ads. Each answers a different question, and confusing them is how stores convince themselves an unprofitable product is fine.
What is a good contribution margin percentage?
There is no universal number, because it depends on your cost structure and how much fixed overhead and profit you need each sale to cover. A digital product with near-zero variable cost can clear ninety-plus percent; a low-priced physical good fighting shipping costs may live in the twenties.
For direct-to-consumer ecommerce specifically, Peel Insights suggests anything above fifty percent counts as a good contribution margin, while noting that a hundred percent is effectively impossible once real production costs enter. Treat that as a rough goalpost, not a law. A 35% margin on a high-volume product can build a great business; a 65% margin on something that sells twice a month cannot.
The more useful question is not "is my percentage good in the abstract" but "does it clear the two things it has to pay for" — your fixed costs, and the cost of getting each customer.
Why the percentage sets your ad-spend ceiling
Here is the profit angle the glossary pages skip entirely.
Your contribution margin percentage tells you the break-even point on advertising. The identity is simple: the return on ad spend you need just to avoid losing money equals one divided by your contribution margin ratio.
Using the 40% before-ads figure from above:
Break-even ROAS = 1 ÷ 0.40 = 2.5
That means every advertising dollar has to bring back at least $2.50 in revenue before the campaign stops eating into your margin. Anything below that return loses money on the order, no matter how healthy the number looks on a platform dashboard. If your contribution margin were only 25%, you would need a return of 1 ÷ 0.25 = 4.0 just to break even — a far harder bar. This is why a thin margin quietly makes paid acquisition brutal.
The same logic governs how much you can pay per customer. The margin left after variable costs is the pool you draw a customer acquisition cost from, and whether that spend pays back depends on how many times a customer returns. That is the bridge from a single-order metric to customer lifetime value — the number that tells you what a customer is worth over the whole relationship, not just one checkout.
Where the numbers usually go wrong
Contribution margin percentage is only as honest as the costs you feed it. A few traps:
- Leaving out fees and shipping. This is the big one. Subtract only COGS and you have computed gross margin, then mislabeled it. The whole point is the full variable stack.
- Treating ad spend inconsistently. Decide whether your headline number is before or after ads, and stay consistent. The before-ads figure judges the product; the after-ads figure judges the product sold through this channel.
- Averages hiding the spread. A blended 40% can mask a bimodal catalog of great products and money-losers. Compute it per product before you scale spend on any of them.
- Scattered data. The costs live in different places — product cost in your catalog, fees in your payment processor, ad spend in Meta and Google. Stitching them by hand per order is where most stores give up. Related channel metrics like cost per thousand impressions and reach sit in yet another silo, which is why a per-order profit view is hard to assemble manually.
Getting the number without a spreadsheet
Calculating contribution margin percentage for one product is a five-minute exercise. Doing it for every order, every day, with live shipping and fee data, is not — which is where most stores lose the thread.
That is the problem PodVector is built to solve. It connects Shopify, Meta Ads, Google Ads, Printify, and Printful, then computes the true per-order profit — revenue minus product cost, shipping, fees, and ad spend — so the contribution on each order is a number you read, not one you rebuild by hand. Victor, its AI employee, analyzes that live data and proposes moves you approve; he reads your ad data but does not touch your ad account, and the changes he makes are on the Shopify side. It is not a dashboard you have to interpret — it is an employee that does the interpreting.
You can still keep the mental model above. Knowing that break-even ROAS is one over your margin, and that shipping and fees are what separate gross from contribution, is what lets you sanity-check any tool's output.
FAQs
What is the difference between contribution margin and contribution margin percentage?
Contribution margin is a dollar figure — revenue minus variable costs for a unit or a period. Contribution margin percentage expresses that same amount as a share of revenue, so you can compare products at different price points. In the example above, the contribution margin is $16 per order and the contribution margin percentage is 40%.
Is contribution margin percentage the same as gross margin?
No, and conflating them is the most common mistake. Gross margin subtracts only cost of goods sold. Contribution margin subtracts every variable cost — COGS plus shipping, payment fees, and fulfillment labor. That is why the same order can show a 60% gross margin and a 40% contribution margin.
What counts as a variable cost?
A cost is variable if it exists because you made one more sale. Product cost, shipping, payment processing, pick-and-pack labor, and ad spend all scale with volume. Rent, salaries, and software subscriptions do not, so they are fixed and stay out of the contribution margin calculation.
Should ad spend be included in contribution margin?
It can be, as long as you are clear about it. Reporting a "before ads" and an "after ads" figure is the cleanest approach: the first tells you whether the product itself is sound, the second tells you whether it survives being sold through paid acquisition. In the worked example those figures were 40% and 15%.
How does contribution margin percentage relate to break-even?
Two ways. For fixed costs, break-even units equal your fixed costs divided by the contribution margin per unit. For advertising, break-even return on ad spend equals one divided by your contribution margin ratio — so a 40% margin needs a 2.5 return just to avoid losing money on the order.
What is a healthy contribution margin percentage for ecommerce?
It depends on your price point and cost structure, so treat benchmarks loosely. For direct-to-consumer brands, some analysts point to above fifty percent as a good target, but a lower margin on a high-volume product can still fund a strong business. The real test is whether the margin covers your fixed costs and your cost of acquiring each customer.