
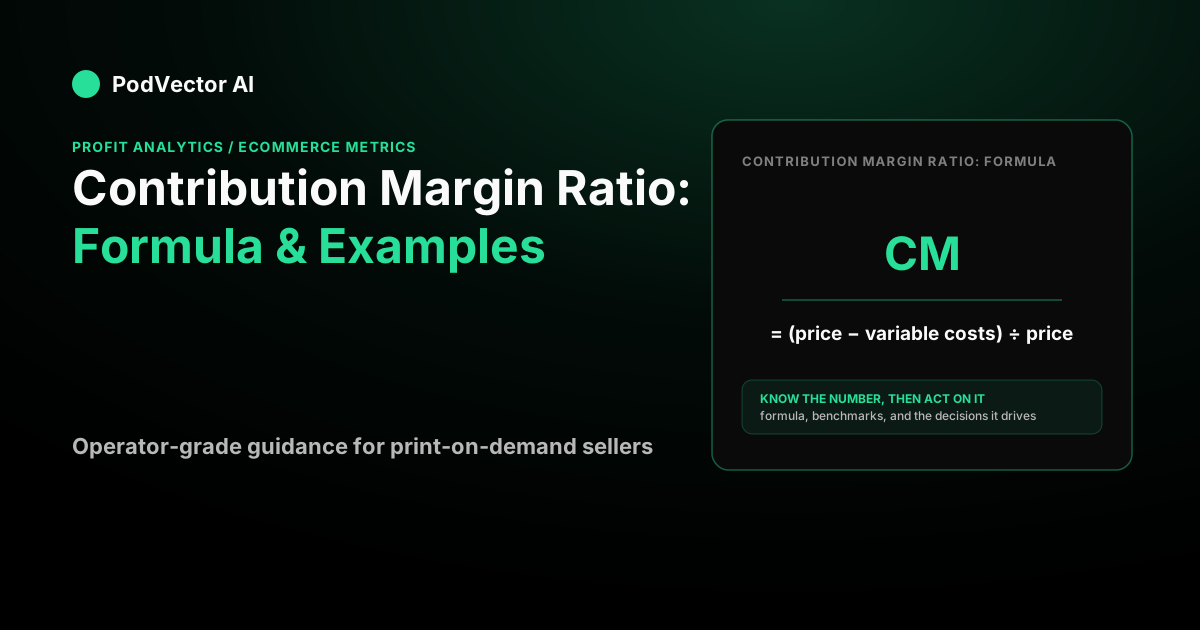
Most guides define the contribution margin ratio with a billion-dollar spreadsheet and leave you no closer to knowing whether your store makes money. This one walks a single real order — blank garment, print, shipping, fees, ads — so you can see exactly where the ratio comes from and why it decides which products are worth scaling.
What is the contribution margin ratio?
The contribution margin ratio is the percentage of revenue left after you subtract all the costs that rise and fall with each sale. According to Xero, "calculating your contribution margin ratio shows you exactly how much of each dollar in revenue is available to cover fixed costs and generate profit." Those variable costs include the product itself, shipping, payment processing fees, and fulfillment labor. Whatever remains "contributes" to covering fixed costs like rent and software — and then to profit.
It is a ratio, not a dollar figure, so it lets you compare a $20 mug and a $60 hoodie on the same scale. A higher ratio means more of every sale is working for you.
The key word is variable. Gross margin only subtracts the cost of the product. The contribution margin ratio subtracts every cost triggered by the order — as Wayflyer notes, variable costs include "product costs, freight, fulfilment, transaction fees, and direct ad spend" — which is why it is the more honest read on whether a sale actually pays.
The contribution margin ratio formula
There are two equivalent ways to write it, and you will see both:
- Per unit:
CM ratio = (Selling price − Variable cost per unit) ÷ Selling price × 100 - In total:
CM ratio = (Revenue − Total variable costs) ÷ Revenue × 100
Both give the same percentage because the ratio is scale-free. If one order clears 40%, then a thousand identical orders also clear 40%.
You can also compute it from the contribution margin dollars you already have: divide contribution margin by revenue. As Corporate Finance Institute defines it, the CM ratio equals "total revenue less all variable costs, divided by its revenue." The only judgment call is deciding which costs count as variable — and that decision is where most stores quietly overstate their margins.
What counts as a variable cost?
This is where the formula gets applied differently across guides, and it matters for POD sellers. Variable costs are costs that fluctuate directly with each order. For a print-on-demand store they typically include:
- Product cost — blank + print charge from your fulfillment partner
- Outbound shipping — carrier cost passed through or absorbed
- Payment processing fees — typically a percentage of transaction value
- Pick / pack / fulfillment labor — per-order labor at the warehouse
- Returns / refunds — the variable cost of reversals at your return rate
- Advertising spend — the per-order cost of acquiring the customer (included in CM3, excluded from CM2)
Fixed costs — monthly software subscriptions, storefront fees, your own salary — stay out of the CM ratio calculation. They show up later, in the break-even analysis that uses the ratio as its input.
A worked example: one print-on-demand order
Say you sell a print-on-demand tee for $40. Here is what actually leaves the building on that one order.
| Line | Amount |
|---|---|
| Revenue (your price) | $40.00 |
| − Product cost (blank + print + base fulfillment) | −$16.00 |
| − Shipping (carrier) | −$5.00 |
| − Payment processing (4% of $40) | −$1.60 |
| − Pick / pack labor | −$1.40 |
| = Contribution margin (CM2) | $16.00 |
Now apply the formula: $16.00 ÷ $40.00 = 0.40, or a 40% contribution margin ratio.
That 40% is the number that matters, and notice how far it sits below the headline gross margin. Product cost alone is $16, so gross margin looks like ($40 − $16) ÷ $40 = 60%. The extra $8 of shipping, fees, and labor is real money, and ignoring it inflates your margin by twenty points. On this order, gross margin says 60% while the contribution margin ratio says 40% — the truth is the lower one. As Wayflyer puts it, "contribution margin gives a more complete picture of per-sale profitability because it captures expenses that gross profit ignores."
Where ad spend fits
For most stores the biggest variable cost is the one that got the order in the door: advertising. Say you spend an average of $10 in ads per order. Subtract it and you get a second, tighter contribution margin:
$16.00 − $10.00 = $6.00, so $6.00 ÷ $40.00 = 15%.
Operators call these tiers CM2 (before ads, 40% here) and CM3 (after ads, 15% here). Both are contribution margin ratios; they just draw the variable-cost line in different places. The pre-ad ratio tells you whether the product is viable. The post-ad ratio tells you whether the product plus this customer acquisition is viable. If you track return on ad spend on Meta, CM3 is where that number turns into real profit or a real loss.
CM ratio benchmarks by business type
There is no universal "good" CM ratio — context determines what's healthy. According to Xero, software and SaaS businesses typically run contribution margin ratios of 70–90% because of minimal variable costs per sale. Physical-goods ecommerce sits much lower once shipping, fulfillment, and ad costs are included. According to Wayflyer, a healthy contribution margin for ecommerce after customer acquisition costs is a minimum of 20%, with sustainable brands targeting above that threshold. POD stores with ad-driven customer acquisition should treat CM3 (post-ad ratio) as the operative number — not CM2 — when assessing whether a product is worth scaling.
Why the ratio matters more than gross margin
Two products can share a 60% gross margin and behave completely differently once shipping and ads are in. A light, cheap-to-ship sticker might hold a high contribution margin ratio, while a bulky hoodie with pricey freight drops substantially. Gross margin would call them twins; the contribution margin ratio tells you which one to put ad budget behind.
That is the whole point of the metric. It answers "should I sell more of this, through this channel, at this acquisition cost?" — a question gross margin cannot touch because it never sees the shipping label or the ad receipt. As Wall Street Prep explains, the ratio "offers useful information that can help guide decisions, such as setting product pricing appropriately to ensure a minimum margin is met."
Contribution margin ratio and break-even
The ratio also tells you exactly how much you need to sell to cover fixed costs. According to Xero, the break-even formula in revenue terms is:
Break-even Revenue = Total Fixed Costs ÷ Contribution Margin Ratio
If your store carries $4,000 a month in rent, software, and salary, and the post-ad contribution margin ratio is 15%:
$4,000 ÷ 0.15 = $26,667 in monthly revenue to break even.
In unit terms, divide fixed costs by the contribution margin dollars per order: $4,000 ÷ $6 = 667 orders per month. Below that volume, you lose money no matter how busy the store looks. This is why a rising order count with a thin contribution margin ratio can still bleed cash — volume only helps once the ratio clears the fixed-cost hurdle.
As CFI notes, you must make sure your contribution margin dollars exceed fixed costs — otherwise the company is not profitable regardless of how busy it looks at the top line.
Break-even ROAS: the number the ratio hands you
Here is the identity that makes the contribution margin ratio indispensable for paid ads. Your break-even return on ad spend is simply one divided by the pre-ad ratio:
Break-even ROAS = 1 ÷ contribution margin ratio (pre-ad)
On the 40% pre-ad ratio above, that is 1 ÷ 0.40 = 2.5. Any campaign returning less than 2.5× on a $40 order is losing money once you net out shipping and fees — even though a naive gross-margin view (1 ÷ 0.60 = 1.67) would tell you 1.67× is fine. The lower, truer ratio raises the bar you actually have to clear.
This is where acquisition cost enters. Your customer acquisition cost has to fit inside the contribution margin, or the sale funds the ad platform instead of you. For more on reading ROAS correctly in a POD context, see our guide to ROAS on Meta Ads for POD sellers. For paid search, see Google Ads strategy for print-on-demand.
How to improve your contribution margin ratio
According to Xero, you have two core levers: increase revenue per sale or reduce variable costs. For a POD store, those translate into four practical moves, in rough order of impact:
- Raise price. Because variable costs are mostly fixed in dollars per order, a price increase drops almost straight to contribution margin. Going from $40 to $44 on the same $24 of variable cost lifts the ratio from 40% to
$20 ÷ $44 ≈ 45%. - Cut product cost. Renegotiating a blank or print cost from $16 to $13 adds $3 of contribution:
$19 ÷ $40 = 47.5%. - Trim shipping and fees. Right-sizing packaging or negotiating lower carrier rates feeds the ratio dollar for dollar.
- Lift conversion rate. A higher conversion rate means fewer ad dollars per order, which is the fastest way to widen the post-ad (CM3) ratio without touching price. See our Klaviyo browse-abandonment flow setup for a concrete example of recovering lost conversions — fewer lost sessions means lower effective ad cost per order.
The trap is chasing all four blind. Raise a price and conversion can sag; cut product cost and quality can slip. You need the true per-order number in front of you before and after each change.
Contribution margin ratio vs. variable expense ratio
A related term you may encounter is the variable expense ratio — total variable expenses divided by total sales. It is the mirror image of the CM ratio: the two always sum to 100%. If your CM ratio is 40%, your variable expense ratio is 60%. Some accounting software displays one, some the other. Knowing the relationship means you can convert between them instantly without re-running the full calculation.
Contribution margin ratio for multi-product stores
When you sell dozens of SKUs, the store-level CM ratio is a weighted average of every product's individual ratio. A single high-volume, low-margin product can drag the blended ratio well below what your best SKUs achieve. This matters for budget allocation: pushing ad spend toward your highest CM-ratio products — not just your highest-revenue ones — is how you lift the store-level ratio over time.
The same logic applies across channels. A product selling organically through SEO may carry a CM3 ratio far above the same product sold through paid social, because the ad cost per order is near zero on the organic side. Tracking ratio by channel, not just by SKU, is the analysis that actually moves the needle. To understand how AI can surface these cross-channel patterns automatically, see The POD Seller's Guide to AI Marketing for Ecommerce.
See your real contribution margin per order
Most stores estimate the ratio from a spreadsheet and never notice when shipping creep or a fee change quietly erodes it. PodVector connects Shopify, Meta Ads, Google Ads, Printify, and Printful, then computes your true per-order profit — product cost, shipping, fees, and ad spend netted out — so the contribution margin you're reading is the real one, not an estimate.
Victor, the AI employee inside PodVector, reads that live data, flags the products and campaigns where the ratio is slipping, and proposes Shopify-side moves — like repricing your worst-margin SKUs to a target margin or raising your free-shipping threshold — that you approve before anything changes. Victor is not a dashboard, and he does not touch your ad account; he reads the numbers and acts on your Shopify store with your sign-off. Start with PodVector free and see the margin behind every order.
To see how Victor fits into a broader POD growth strategy, read what PodVector does for POD sellers or explore how voice AI is changing ecommerce operations.
FAQs
What is a good contribution margin ratio?
It depends on your business model. According to Wayflyer, a healthy contribution margin for ecommerce after customer acquisition costs is a minimum of 20%, with sustainable brands targeting above that. The practical test is whether the ratio clears your break-even ROAS with room to spare: if 1 ÷ ratio is well under the return your ads actually deliver, you have healthy margin. A store selling digital goods can run a very high ratio because it has almost no variable cost per order, while a physical-goods POD store with real shipping and ad costs will sit lower and still be perfectly profitable.
What is the difference between contribution margin and contribution margin ratio?
Contribution margin is a dollar figure — revenue minus variable costs, like the $16 per order in the example above. The contribution margin ratio expresses that same gap as a percentage of revenue ($16 ÷ $40 = 40%). Use the dollars to see per-order profit and to run break-even in units; use the ratio to compare products at different price points and to derive break-even ROAS.
Does the contribution margin ratio include ad spend?
It can, and the honest version usually should. A pre-ad ratio (CM2) subtracts product, shipping, fees, and fulfillment to judge whether the product itself works. A post-ad ratio (CM3) also subtracts advertising to judge whether the product plus this customer's acquisition cost works. Name which one you mean, because on the example order they are 40% and 15% — a big difference when you're deciding what to scale.
How is contribution margin ratio different from gross margin?
Gross margin subtracts only the cost of the product. The contribution margin ratio subtracts every variable cost the order triggers — product, shipping, payment fees, pick-and-pack, and often ads. On the worked order, gross margin reads 60% while the contribution margin ratio reads 40%, because the $8 of shipping, fees, and labor is invisible to gross margin. As Wayflyer explains, "contribution margin gives a more complete picture of per-sale profitability because it captures expenses that gross profit ignores."
Can the contribution margin ratio be negative?
Yes, and it's a red flag worth acting on immediately. A negative ratio means variable costs exceed the sale price, so every order deepens the loss and selling more makes it worse. It usually shows up on heavily discounted items, products with expensive shipping relative to price, or campaigns where the ad cost per order runs above the contribution margin. When you spot it, the fix is to raise price, cut variable cost, or stop selling that item through that channel — not to push more volume.
What is the variable expense ratio and how does it relate?
The variable expense ratio is the mirror of the CM ratio — it equals total variable costs divided by total sales. The two always sum to 100%. If your CM ratio is 40%, your variable expense ratio is 60%. Some accounting tools display one; some display the other. Knowing this relationship lets you convert between them instantly.
How do I use the CM ratio for pricing decisions?
Start by calculating your current CM ratio per SKU. Then model the effect of a price change: because variable costs are mostly fixed in dollars per order, a price increase of a few dollars drops almost entirely into contribution margin dollars, lifting the ratio. Wall Street Prep notes the ratio "can help guide decisions, such as setting product pricing appropriately to ensure a minimum margin is met." Compare the new ratio against your break-even ROAS to confirm the price is high enough to clear your ad costs profitably. For a Shopify-specific walkthrough of repricing low-margin SKUs, see how PodVector approaches margin recovery.