
Click-through rate is the simplest performance number in marketing, and also the most misread. The formula takes ten seconds. Understanding what a given CTR is actually worth to your bottom line takes a little longer — and that gap is where most sellers lose money. This guide walks the calculation, the benchmarks, and the trap of optimizing a rate that has nothing to do with profit.
The CTR formula
Here is the whole thing:
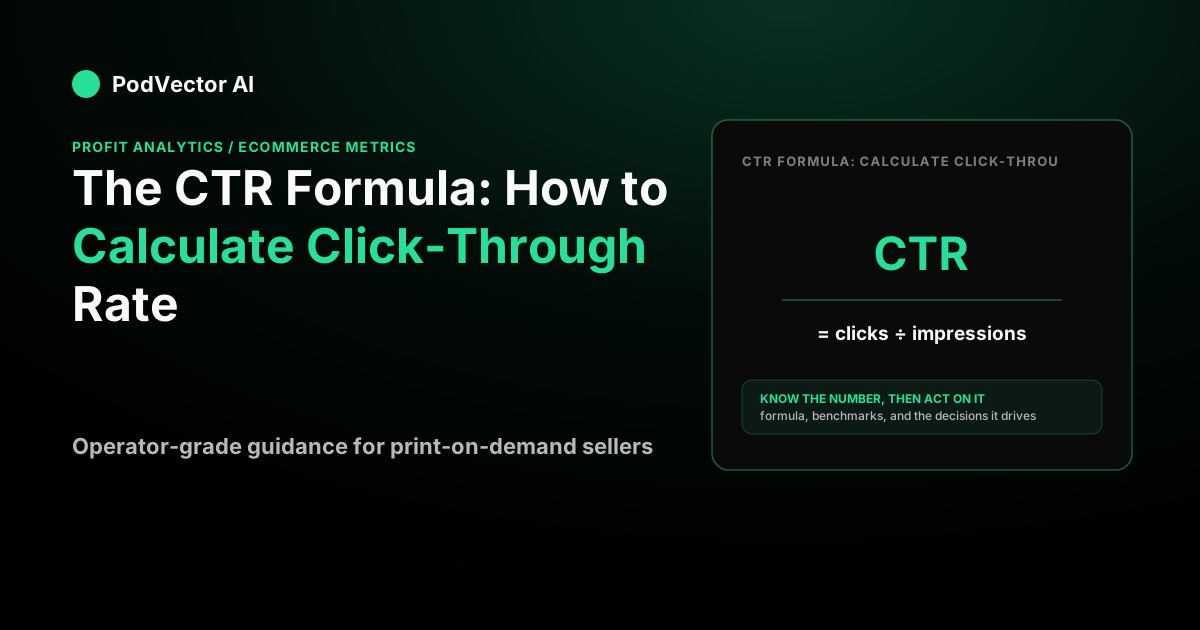
CTR = Clicks ÷ Impressions × 100
- Clicks — the number of times someone clicked your ad, link, listing, or button.
- Impressions — the number of times it was displayed, whether or not anyone clicked.
- × 100 — converts the decimal into a percentage so you can read it at a glance.
That is it. CTR is a ratio between "shown" and "acted on," expressed as a percent. Every platform — Google, Meta, your email tool, your Shopify search bar — reports it, and every one of them uses this same shape.
A worked example
Say you run a Meta prospecting campaign for a print-on-demand apparel store. Over a week, your ad set spends its budget and Meta reports the following:
- Impressions: 250,000
- Link clicks: 3,500
Plug it in: 3,500 ÷ 250,000 = 0.014, and 0.014 × 100 = 1.4% CTR. Out of every hundred people who saw the ad, roughly one and a half clicked through to your store.
Now flip it. If you know your CTR and your impressions, you can forecast clicks: 250,000 impressions × 1.4% = 3,500 clicks. And if you know your target clicks and expected CTR, you can back into the impressions you need to buy. The formula runs in every direction.
Clicks vs. link clicks: the input trap
The formula is trivial. The inputs are where people go wrong, and it almost always comes down to which clicks and which impressions you feed it.
Meta, for example, reports "clicks (all)" — a bucket that includes likes, comments, shares, and profile taps — alongside "link clicks," which are the ones that actually send someone to your site. Compute CTR off "clicks (all)" and the number looks flattering but means nothing for traffic. For any calculation that connects to on-site behavior, use link clicks, or better yet landing-page views, which filter out clicks that bounced before your page loaded.
The same discipline applies to impressions. Are you counting served impressions or viewable ones? Unique reach or total exposures? A CTR is only comparable to another CTR when both use the same numerator and the same denominator. Standardize before you compare periods, channels, or campaigns.
What is a good CTR?
"Good" depends entirely on the channel, because the intent behind an impression varies wildly. Someone typing a query into Google is hunting; someone scrolling Instagram is not. As AdLibrary's 2026 CTR guide notes, there is no single number that works everywhere — the right benchmark matters more than any universal target.
For paid search, WebFX's 2026 benchmark data puts Google Search ads at an average of 3.17% and Display Network ads at 0.46% — a gap that reflects the difference between high-intent queries and passive browsing. Bitly's 2026 benchmark guide, citing WordStream's latest Google Ads data, puts the average Google search CTR at 6.64% — a higher figure because it blends all match types and industries. Either way, search ads consistently outperform display by a wide margin.
On Meta, expectations are lower because the audience is cold. SEOProfy's 2026 benchmark analysis reports that for Facebook and Instagram, a CTR of 0.9% is considered good for most advertisers, and AdLibrary's 2026 guide puts healthy Meta feed CTR in roughly the 1–2% range. So the 1.4% CTR from the worked example above sits inside the normal band for a cold prospecting audience — not alarming, but not exceptional either.
For email, SEOProfy's 2026 data puts the email campaign average at 2.27% CTR, while Ignite Visibility's 2026 guide notes that a good CTR for email marketing generally falls in the 2–5% range depending on industry, email type, and list quality.
One newer factor worth tracking: SEOProfy's 2026 analysis reports that for searches featuring AI Overviews, organic click-through rates have fallen by as much as 61% since mid-2024 — a shift that affects how you read Search Console data for any organic pages you're monitoring alongside your paid campaigns.
The lesson: never judge a CTR against a universal number. Judge it against the same channel, the same audience temperature, and your own trailing average.
Meta's Andromeda model and CTR as a diagnostic
A 2026-specific development worth flagging for POD sellers running Meta ads: AdLibrary's 2026 CTR guide explains that Meta's Andromeda model now decides who sees your creative before any human-facing number matters, which means CTR has shifted from a delivery lever to a diagnostic. The platform grades your ad in real time; your CTR reflects how that grading plays out with the audience Andromeda chose, not a random slice of your targeting. The practical implication is to read CTR segmented by placement and audience temperature — and pair it with hook rate and through-play metrics for video creatives — rather than treating a single blended number as actionable on its own. AdLibrary also notes that ad fatigue under Andromeda now compresses to roughly two to three weeks, so a CTR that looks fine today can decay fast.
Why CTR alone can bankrupt you
Here is the uncomfortable part. CTR measures interest, not money. You can double your CTR and lose more per order than before, because a click is not a sale, and a sale is not a profit.
Watch how the chain works for a hypothetical store. Say your cost per click is $0.50 and your landing page converts 3% of clicks into orders. That means each order costs you 0.50 ÷ 0.03 = $16.67 in ad spend. Now suppose a new creative lifts CTR from 1.4% to 2.8% — a genuine win on paper — but the extra clicks are lower-intent, and conversion drops to 1.5%. Your cost per click might fall as CTR rises, yet cost per order climbs steeply. Higher CTR, worse economics.
As WebFX's 2026 CTR guide puts it, a higher CTR only helps if the clicks are qualified and lead to conversions. CTR is a diagnostic, not a destination. It tells you whether your creative and targeting earn attention. It says nothing about whether the resulting traffic buys, or whether the margin on what they buy covers the acquisition cost. To see that, you have to walk the whole funnel — CTR into checkout completion rate, conversion rate into cost per order, and cost per order against true per-unit profit.
How CTR chains into the metrics that matter
CTR is the first link in a chain, and each link multiplies with the next:
- CTR → CPC. More clicks per impression usually lowers your cost per click, because platforms reward relevance.
- CPC → CPA. Cost per acquisition equals CPC ÷ conversion rate. Cheaper clicks help, but only if conversion holds.
- CPA → profit. An order is only profitable if its margin exceeds its fully-loaded acquisition cost.
Because these compound, a CTR win that quietly wrecks conversion or margin can leave you worse off. The number to protect is not the top of the funnel — it is the profit at the bottom. See also how PodVector fits into a broader POD growth strategy and what the Printful pricing calculator reveals about keeping per-unit margins healthy before you scale spend.
CTR across different channels
The formula never changes, but its name and context shift by surface:
- Paid search & social: clicks ÷ impressions. The default meaning of "CTR." AdLibrary's 2026 guide puts healthy 2026 ranges at roughly 1–2% on Meta feed, 3–6% on Google Search, and 1–3% on TikTok.
- Email: clicks ÷ delivered emails (bounced emails are excluded, since they were never shown). Watch out for click-to-open rate (CTOR), which divides clicks by opens instead of deliveries — a different number from the same campaign, as SEOProfy's 2026 analysis explains.
- Organic search: clicks ÷ impressions in Google Search Console, where "impressions" means the times your result appeared in the SERP. AI Overviews are now compressing these rates significantly for many queries.
- On-site: clicks on a banner, recommendation, or search suggestion ÷ times it was shown.
Same arithmetic, different denominator. Always confirm which denominator a platform is using before you trust its CTR label. Quimby Digital's 2026 CTR guide makes the same point: some email platforms calculate clicks using delivered emails, while others emphasize click-to-open rate, so confirming definitions before comparing reports is essential.
AI Overviews and CTR in 2026
A notable development for anyone monitoring organic CTR: Google's AI Overviews have materially changed what "position 1" means. SEOProfy's 2026 benchmark analysis reports that for searches featuring AI Overviews, organic click-through rates have declined by as much as 61% since mid-2024 — meaning a top-ranked organic result may now receive a fraction of the clicks it once did. This is especially relevant for POD sellers who rely on organic traffic to reduce paid ad dependency: if your Google Search Console CTR has dipped without a ranking change, AI Overviews are likely the cause, not your titles or meta descriptions.
The practical response is to lean harder on branded search and bottom-of-funnel queries where users are closer to purchase and AI answers are less likely to satisfy intent. Paid search, where you control placement, is less exposed to this shift. For POD sellers specifically, pairing organic content with ad data in one view is where platforms like PodVector add signal — Victor reads your Google Ads data alongside Shopify so you can see whether paid is picking up what organic is losing.
From CTR to true profit
CTR tells you the top of the funnel is working. It cannot tell you whether the customer at the bottom made you money — that requires stitching ad data to fulfillment cost, payment fees, shipping, and product cost, order by order.
That stitching is exactly what PodVector does. It connects Shopify, Meta Ads, Google Ads, Printify, and Printful into a live data warehouse, then computes true per-order profit so you can see whether a high-CTR campaign is actually feeding the bank account. Victor, its AI employee, analyzes that live data and proposes moves — and, with your approval, executes Shopify-side changes such as repricing products, adjusting discounts, or raising the free-shipping threshold. He reads your ad data to find the leaks, but he does not touch your ad account directly. If you want the profit truth behind your click-through rates, start with PodVector.
For POD sellers running print-on-demand on Shopify, understanding the full profit chain also means knowing your fulfillment costs inside out. See the full breakdown of Printful t-shirt costs and the Printify hoodie cost breakdown to understand what margin you're actually defending when you optimize CTR. And if you're still building out your store, the step-by-step guide to starting a print-on-demand business covers the full picture from product to ad spend. See also how PodVector fits into a broader POD growth strategy.
FAQs
What is the CTR formula?
CTR equals clicks divided by impressions, multiplied by 100 to get a percentage. If a link was shown 5,000 times and clicked 150 times, its CTR is 150 ÷ 5,000 × 100 = 3%. The same formula applies to ads, emails, organic search results, and on-site elements.
Is a higher CTR always better?
No. A higher CTR means more people are clicking, which is usually good for cost per click, but it says nothing about whether those clicks convert or whether the resulting orders are profitable. A creative that boosts CTR while attracting lower-intent traffic can raise your cost per order even as CTR climbs. Always trace CTR through to conversion rate and per-order profit before celebrating.
What counts as a good CTR?
It depends on the channel. WebFX's 2026 benchmark data puts Google Search ads at an average of 3.17% and Display ads at 0.46%. For Facebook and Instagram, SEOProfy's 2026 data puts a good CTR at around 0.9%, while AdLibrary's 2026 guide places the healthy Meta feed range at roughly 1–2%. For email, SEOProfy reports a 2.27% average. Cold social audiences run lower than high-intent branded search, so compare against the same channel and audience type — never a single universal number.
Should I use "clicks (all)" or "link clicks" for CTR?
Use link clicks (or landing-page views) whenever the CTR connects to on-site behavior. Platforms like Meta report a broader "clicks (all)" bucket that includes likes, comments, and profile taps, which inflates the rate without sending anyone to your site. Feeding "clicks (all)" into your CTR overstates how many people actually reached your store.
How is email CTR different?
Email CTR divides clicks by delivered emails rather than impressions, because bounced messages were never shown and should be excluded. Watch out for click-to-open rate (CTOR), a related but distinct metric that divides clicks by opens instead of by deliveries — the two produce very different numbers from the same campaign, as SEOProfy's 2026 analysis notes.
Does CTR affect my ad costs?
Yes, indirectly. Ad platforms use CTR as a signal of relevance, and higher relevance often earns you a lower cost per click and better placement. But that discount only helps your bottom line if the extra clicks still convert and the orders stay profitable — a cheaper click that never buys is not a saving.
How have AI Overviews changed organic CTR?
Significantly. SEOProfy's 2026 benchmark analysis reports organic CTRs have fallen by as much as 61% for searches that include an AI Overview, compared to mid-2024 baselines. If you track organic CTR in Google Search Console and have seen unexplained drops, AI Overviews are likely compressing your clicks even if your rankings haven't moved. The fix is to target queries where purchase intent is high enough that a summary answer doesn't satisfy the searcher.
What is the difference between CTR and CTOR?
CTR (click-through rate) divides clicks by total impressions or delivered messages — it measures how much of your full audience acted. CTOR (click-to-open rate) divides clicks by opens only — it measures how compelling your email body and links are among people who already opened. SEOProfy's 2026 data recommends using CTOR when you want to diagnose email body performance specifically, rather than delivery or subject-line performance.
How does CTR relate to print-on-demand profitability?
For POD sellers, CTR is the entry point but profit is the destination. A strong CTR on a Meta or Google campaign means your creative is earning attention — but whether that attention becomes margin depends on your conversion rate, average order value, and the gap between what Printify or Printful charges you and what the customer pays. Use the Printify-to-Etsy integration guide and the Printify vs. Gelato comparison to stress-test your supplier costs before you scale ad spend chasing higher CTR.