
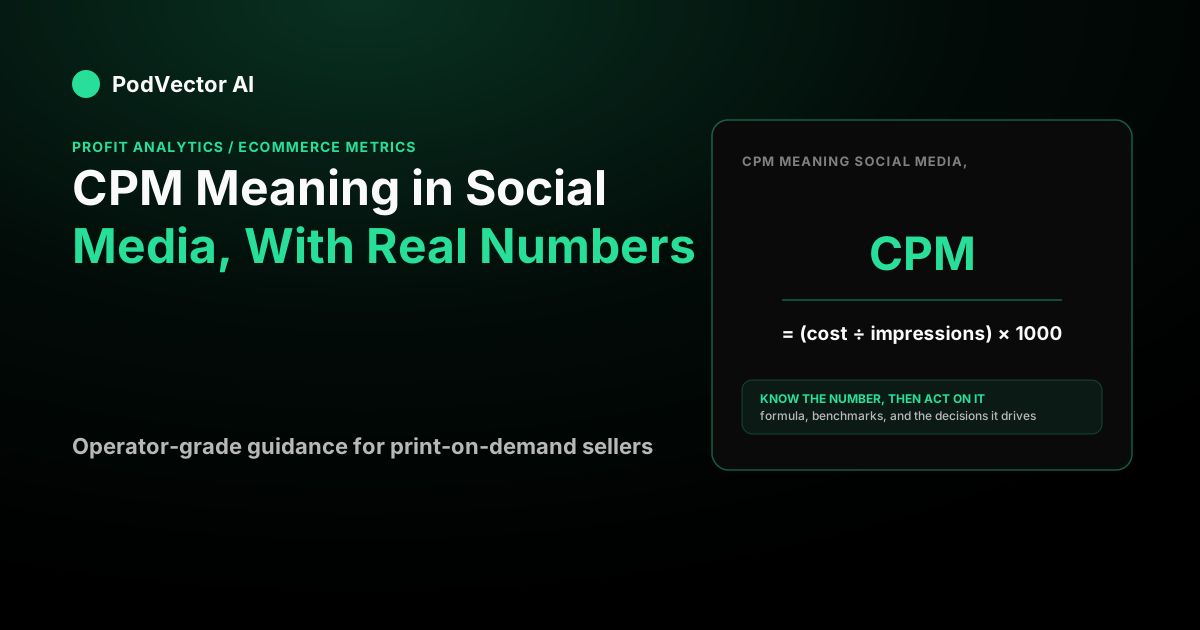
What does CPM mean in social media?
CPM stands for cost per mille, where "mille" is Latin for thousand. In plain terms, CPM is what a social platform charges you to serve your ad one thousand times. One "serve" is an impression — a single appearance of your ad on someone's screen.
You will see CPM in Meta Ads Manager and every other self-serve ad tool. It is the base unit platforms use to price ad inventory, because ads are ultimately sold by the eyeball. Every other cost metric — cost per click, cost per order — is downstream of how much you paid to be seen.
Because CPM is charged per impression rather than per click, it is an awareness metric first. It answers "how expensive is it to reach people here?" and nothing more. That is a useful question. It is just not the question that pays your bills, which is why the second half of this guide connects CPM to actual per-order profit.
The CPM formula (with a worked example)
The math is simple. Take what you spent, divide by impressions, and multiply by one thousand:
CPM = (Ad spend ÷ Impressions) × 1,000
Say you spend $500 on an Instagram campaign and it gets served 100,000 times. Your CPM is ($500 ÷ 100,000) × 1,000 = $5.00. You paid five dollars for every thousand times your ad appeared.
You can also flip the formula to plan a budget. If you know your platform's typical CPM and how many impressions you want, then Ad spend = (CPM ÷ 1,000) × Impressions. Wanting 400,000 impressions at a $6.00 CPM implies a budget of ($6 ÷ 1,000) × 400,000 = $2,400.
One trap: impressions are not people. If your ad is shown to the same person four times, that is four impressions and one reached human. That gap is called frequency, and rising frequency against a flat CPM is often the first sign an audience is getting worn out.
What is a good CPM on social media?
There is no single "good" number, because CPM swings with the platform, the audience, the season, and how well your creative performs. According to Evokad's 2026 social advertising guide, the average global CPM climbed to $8.74, up from $7.91 the prior year, reflecting intensified competition for user attention across platforms.
Within that global average, the spread by industry and advertiser type is wide. Two 2026 data points illustrate:
- Lebesgue's 2026 Facebook Ads benchmark data puts Facebook CPM between roughly $6.96 and $12.46 depending on industry, with Beauty and Health at the top of that range.
- Visible Factors' 2026 Facebook Ads analysis found the median Meta CPM across all industries landed at $13.48 in 2025, reflecting the premium brands pay inside a crowded auction environment.
The gap between those figures is not a contradiction — it reflects who is in each dataset and what objective the campaigns were optimising toward. Print-on-demand sellers on Meta should benchmark toward the higher end of these ranges, since ecommerce DTC competes directly against the most aggressive bidders in the auction.
A rough orientation from current trackers: broad prospecting under $10 CPM is efficient, $10–$15 reflects a competitive direct-response environment, and $20+ is territory for high-margin verticals like health and finance. But the number that matters most is not your CPM — it is whether the profit that survives all the way to your bank account justifies the price of entry.
CPM by platform in 2026
Platform matters as much as industry. A few directional points from current 2026 benchmark data:
- Meta (Facebook & Instagram): Emplifi's 2026 social media benchmarks note that Instagram carries the highest CPMs within Meta, reflecting intense competition for impressions, while Facebook CPMs are more efficient. The Evokad 2026 guide puts the global average near $8.74, while ecommerce-focused panels run higher.
- LinkedIn: The Jonas Agency's 2026 paid social benchmarks place LinkedIn CPMs at $20–$45, the highest of any major social platform, reflecting its professional audience premium. Conversion rates for relevant verticals are correspondingly higher, which is why the cost can still close profitably for B2B.
- TikTok: Emplifi confirms TikTok delivers lower CPMs than Meta platforms, though the gap continues to narrow as TikTok's auction matures and advertiser demand grows.
- X (Twitter): Maintains the lowest CPMs among the measured major platforms, per Emplifi's 2026 data, though reach and audience quality for ecommerce are correspondingly limited.
Two things matter more than any headline number. First, cheaper is not automatically better — a low CPM on a poorly targeted audience wastes impressions on people who will never buy. Second, CPM varies enormously by industry, objective, and season; the same account can see a low CPM on a broad awareness campaign and a much higher one on a tightly targeted retargeting audience. Compare your CPM to your own history and your own margins, not to a stranger's screenshot.
How seasonality moves CPM
Seasonality is one of the biggest and most predictable CPM drivers, and it catches print-on-demand sellers every year. According to Evokad's 2026 social advertising guide, which cites Gupta Media's State of Social Media CPM Report covering tens of billions of ad impressions, CPMs can surge up to 66% during the Q4 holiday shopping season. Peak periods like Black Friday and Cyber Monday have historically pushed rates even higher than that average.
Additionally, The Jonas Agency's 2026 paid social benchmark report cites Varos's Q4 2025 data showing the average CPM across all social platforms rose 8–12% year-over-year in 2025 — meaning the baseline heading into Q4 2026 is already elevated before seasonal demand kicks in.
The practical implication: a CPM that looked healthy in August can look completely different in November. Plan Q4 budgets with that inflation baked in, or shift spend to lower-competition windows where efficiency improves. The post-Christmas "Q5" window — roughly December 26 through early January — is frequently one of the cheapest periods to buy impressions, per the same Gupta Media seasonal analysis cited in Evokad.
Why CPM alone can mislead you
Here is the uncomfortable part most glossaries skip. A falling CPM feels like a win, but CPM says nothing about revenue and even less about profit. You can drive CPM down by chasing cheap, low-intent impressions and end up spending more per sale, not less.
The metric that actually matters is what each impression is worth to you after it travels down the funnel. Impressions turn into clicks, clicks turn into orders, and orders carry costs — product, shipping, fees, and the ad spend itself.
From CPM to cost per order
Let's walk the whole chain with an example store. Say you sell print-on-demand apparel, your average order value is $40, and one campaign spends $1,000.
- At a $10 CPM, $1,000 buys
($1,000 ÷ $10) × 1,000 = 100,000impressions. - At a 1% click-through rate, that is
100,000 × 0.01 = 1,000clicks, so your cost per click is$1,000 ÷ 1,000 = $1.00. - At a 2% conversion rate on those clicks, you get
1,000 × 0.02 = 20orders, so your cost per order is$1,000 ÷ 20 = $50.00.
Notice what happened. Your CPM looked healthy at $10, but you spent $50 to win a $40 order. On revenue alone that is a loss before you have paid for the product. This is exactly why cost per click and average order value matter more than CPM once you are optimizing for sales rather than reach.
Now layer in profit. If that $40 order costs you $16 in product and roughly $8 in shipping, fees, and fulfillment, your margin before ads is about $16 — not $40. Against a $50 cost per order, the campaign is deep underwater even though the CPM was "good."
The lesson: CPM is the entry price of attention. Whether that attention is worth buying depends on the profit that survives all the way to the bottom of the funnel. See the full Printful t-shirt cost breakdown and the Printify hoodie cost breakdown for real fulfillment floor numbers to use in this math.
CPM vs CPC vs CPA: which metric to lead with
Social ads are priced and reported in three primary ways: CPM (cost per thousand impressions), CPC (cost per click), and CPA (cost per acquisition such as a purchase). They sit at different stages of the funnel and answer different questions:
- CPM measures the price of being seen. Use it to gauge delivery efficiency and audience competitiveness.
- CPC measures the price of a visit. A low CPC relative to your CPM means your creative is earning clicks at a good rate.
- CPA measures the price of a result. For a POD seller, this is usually cost per purchase — the number you can actually compare to margin.
The three are mathematically linked: CPC = CPM ÷ (CTR × 10) and CPA = CPC ÷ conversion rate. That chain means a problem anywhere — weak creative, thin audience, poor landing page — compounds into a higher CPA even if your CPM looks fine.
Lebesgue's 2026 Facebook benchmark data puts most industries at a Facebook CTR between 2% and 3%, which is a useful reference point for stress-testing your own CPM-to-CPC math. If your CTR is meaningfully below that range, the creative — not the CPM — is the leak.
Most platforms now optimize toward your chosen objective automatically, so the more useful question is rarely "should I buy on CPM or CPC?" and more "is the full chain from impression to profit closing at a margin I can live with?"
How to lower your CPM (without buying junk impressions)
If your CPM is genuinely too high, a few levers move it in the right direction:
- Improve creative. Platforms reward ads people engage with by charging less to deliver them. Strong hooks and native-feeling video usually pull CPM down. Creative fatigue — when frequency climbs and CTR sinks — causes the auction to charge more for the same delivery, making refresh timing a direct cost lever.
- Maintain creative diversity. Accounts managing genuinely varied creative portfolios consistently hold lower CPMs than those running near-identical variants. According to The Jonas Agency's 2026 paid social benchmarks, Meta's Advantage+ campaigns have been outperforming manual targeting, and creative quality is the primary differentiator within that system.
- Widen thin audiences. Very small audiences get expensive fast because you are competing hard for the same few thousand people. Broadening targeting often cuts CPM.
- Watch frequency. When the same people see your ad too often, delivery gets costlier and results slip. Refresh creative before fatigue sets in.
- Mind the calendar. CPMs spike in Q4 as everyone bids for holiday attention and fall sharply in early Q1. Plan budgets around that rhythm.
But lowering CPM is only worth doing if the cheaper impressions still convert. Optimizing CPM in isolation is how accounts end up with beautiful delivery metrics and an empty bank account.
CPM on Meta vs Google: what POD sellers need to know
Most print-on-demand sellers run budgets across both Meta and Google, which introduces a comparison problem: the two platforms report CPM differently and serve impressions in fundamentally different intent contexts. A Meta impression reaches someone scrolling who has not searched for anything; a Google Display impression may reach someone mid-research. Comparing raw CPM across platforms without accounting for that intent gap leads to bad budget decisions.
The more useful cross-platform question is cost per acquisition by channel — which channel is delivering profitable orders, not just cheap impressions. The Meta vs Google Ads performance guide for POD sellers and the Google Ads vs Facebook Ads comparison both walk through how to make that call with real ecommerce data.
CPM and ad attribution: a note for POD sellers
One issue that compounds CPM analysis for print-on-demand sellers running both Meta and Google ads is attribution accuracy. When Google Ads conversion tracking is misconfigured — specifically when ValueTrack tokens are missing — store-side purchase-on-ad-spend data can be silently wrong. That means your "cheap" Google CPM may appear to be driving more revenue than it actually is, because the attribution is broken rather than the campaign being genuinely efficient.
If you run Google alongside Meta, verifying your conversion tracking setup before drawing conclusions from CPM or POAS comparisons is not optional — it is the foundation. The Google Ads data-driven attribution guide for POD sellers explains how the attribution model affects what your CPM figures actually mean for profitability.
The same logic applies on Meta. Platform-reported CPM and ROAS figures can diverge from true store-side performance, which is why reading ad-platform data alongside Shopify order and margin data — rather than trusting either in isolation — gives you an honest picture.
Where PodVector fits
The reason CPM misleads is that the number lives in your ad platform, while the profit lives in your store — and the two rarely talk to each other. PodVector ingests data from Shopify, Meta Ads, Google Ads, Printify, and Printful into a live data warehouse, so the true per-order profit behind your impressions is visible in one place rather than scattered across separate tools.
Victor, PodVector's AI employee, reads that ad and store data together and proposes moves you approve. Victor is not a dashboard, and he does not act on your ad accounts — he reads Meta and Google data, shows you where reach is being paid for without payback, and then executes approved changes on the Shopify side: repricing margin-losing SKUs, adjusting your free-shipping threshold, or restructuring discounts. Every proposed action shows the old and new values before anything changes.
For POD sellers whose margin analysis depends on knowing actual fulfillment costs, it is worth noting that Victor ingests Printify and Printful costs from completed orders — so a brand-new store with no sales history will not yet have the production cost data needed for a margin answer. Once orders are flowing, the picture sharpens quickly.
Understanding how ad spend connects to true profit at the SKU level is also relevant when setting prices. The full Printful t-shirt cost breakdown and the Printify hoodie cost breakdown show how fulfillment costs set the floor your CPM math has to beat. For sellers choosing between suppliers, the Printful vs Printify comparison and the Printify free shipping breakdown are useful reads alongside your ad cost analysis.
Start with PodVector to see the per-order profit behind your ad spend.
FAQs
What does CPM stand for?
CPM stands for cost per mille, which means cost per thousand. On social media it is the amount you pay for one thousand ad impressions — one thousand appearances of your ad on screen.
How is CPM calculated?
Divide your ad spend by the number of impressions, then multiply by one thousand: CPM = (Ad spend ÷ Impressions) × 1,000. So $300 spent for 60,000 impressions is ($300 ÷ 60,000) × 1,000 = $5.00.
Is a low CPM always good?
No. A low CPM only means cheap reach. If those impressions go to people who never buy, a low CPM can cost you more per sale than a higher CPM aimed at the right audience. Judge CPM against conversions and profit, not on its own.
What is the difference between CPM, CPC, and CPA?
CPM is cost per thousand impressions, CPC is cost per click, and CPA is cost per action such as a purchase. They sit at different funnel stages: CPM measures the price of being seen, CPC the price of a visit, and CPA the price of a result. All three are linked — CPA = CPC ÷ conversion rate — so a problem in one propagates through all three.
Is CPM or CPC better for social media ads?
It depends on your goal. CPM-style buying suits awareness campaigns where you want maximum reach, while CPC-focused optimization suits campaigns chasing clicks and sales. Most platforms now optimize toward your chosen objective automatically, so the more useful question is whether the impressions convert at a margin you can sustain, not which billing label is attached.
Why did my CPM suddenly go up?
Common causes are seasonal auction pressure — CPMs can surge significantly during Q4 according to Gupta Media's data cited by Evokad — rising ad frequency on a small audience, creative fatigue that causes the platform to charge more for the same delivery, or a tighter and more competitive target audience. Varos's Q4 2025 data, cited by The Jonas Agency, found CPMs rose 8–12% year-over-year across social platforms in 2025, so some baseline increase is structural, not just seasonal. Check frequency and creative freshness first — those move CPM fastest and are the most directly within your control.
What is a good CPM for print-on-demand sellers on Meta?
For ecommerce DTC sellers — the category closest to POD — Meta CPMs tend to run higher than the broad platform average. Visible Factors' 2026 analysis found the median Meta CPM across all industries at $13.48 in 2025, and Lebesgue's 2026 industry breakdown shows Beauty and Health — arguably the most comparable vertical to POD apparel — at the top of the $6.96–$12.46 Facebook CPM range. The more important question is not whether your CPM is "good" in isolation, but whether the cost per order that results from it leaves you a margin after fulfillment.
How does CPM relate to ROAS and profit?
CPM is the starting point of the chain: impressions → clicks → orders → revenue → margin. A lower CPM gives you more impressions per dollar, but ROAS (return on ad spend) measures what revenue came back, and neither CPM nor ROAS tells you whether you kept any margin after fulfillment costs. For POD sellers, the relevant number is profit per order after product cost, fulfillment fees, and ad spend — which is why reading CPM alongside your Shopify margin data matters more than optimizing any single metric in isolation. The Printify integration setup guide and the Printful vs Printify comparison are useful starting points for understanding the cost side of that equation before benchmarking your ad efficiency.