
What LTV actually measures
LTV (lifetime value, sometimes written CLV for customer lifetime value) is the total value one customer generates across their whole relationship with you. According to LTV.ai, it is the single most important metric in ecommerce because it determines whether your business model is sustainable: you can acquire customers at a loss and still build a profitable company, but only if each customer's lifetime value exceeds what you paid to get them by a meaningful margin.
That makes it the one number that tells you whether your growth is healthy or quietly bleeding cash. If you spend more to acquire a customer than they ever return, no amount of top-line revenue growth saves you.
Most guides stop at a revenue number. That's the mistake this article fixes — a revenue LTV flatters you, while a margin-based LTV tells the truth.
The LTV formula (three inputs, then a fourth)
The standard revenue-basis formula every guide shows you is:
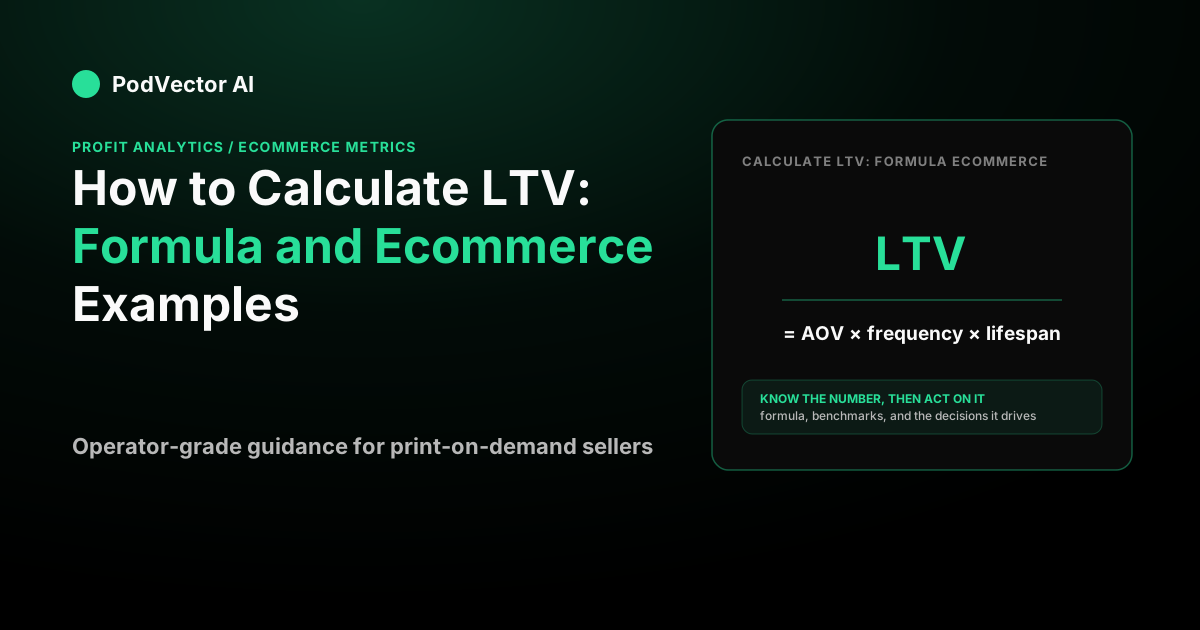
LTV = Average Order Value × Purchase Frequency × Customer Lifespan
- Average order value (AOV) — revenue ÷ orders over a period.
- Purchase frequency — orders ÷ unique customers per year.
- Customer lifespan — the average number of years someone keeps buying.
The problem: this counts revenue you never keep. A $40 order isn't $40 of value — you paid for the product, shipping, and card fees. So the honest version adds a fourth term:
LTV = AOV × Purchase Frequency × Customer Lifespan × Gross-Margin Ratio
As wcart.io notes, this is the simplest reliable formula because gross margin is where profit enters. If you're shaky on gross margin, our guide to net profit margin benchmarks gives useful context for where your numbers should land.
An alternative: the churn-rate formula
If you track monthly revenue per customer, there is a faster shortcut. Wcart.io describes it as:
LTV = (Average Revenue Per User × Gross Margin) ÷ Churn Rate
This is useful for a quick monthly sanity-check when you have reliable churn figures but less certainty about exact lifespan. Both formulas converge on the same answer when the inputs are consistent — use whichever matches your data maturity.
The predictive (discount-rate) version
For a more rigorous view, Shopify's CLV guide surfaces a predictive formula: CLV = Gross Margin Per Customer Lifespan × [Retention Rate ÷ (1 + Discount Rate − Retention Rate)]. The discount rate accounts for the time value of money — future revenue is worth less than today's revenue. For most POD sellers the simple formula is accurate enough, but the predictive version matters if you are modeling customer cohorts for investor reporting or longer retention windows.
A worked example (revenue vs. profit)
Say you run a print-on-demand apparel store. Pull four numbers from your own data:
- AOV: $40
- Purchase frequency: 1.6 orders per year
- Customer lifespan: 2 years
- Gross-margin ratio: 60% (a $40 order costs you $16 to produce and ship)
Revenue-basis LTV: $40 × 1.6 × 2 = $128.
Margin-basis LTV: $128 × 0.60 = $76.80.
Same customer, two very different numbers. The $128 is what they spend; the $76.80 is what you actually keep before overhead. If you compare a $128 revenue LTV against a profit-based acquisition cost, you'll overstate your health by nearly half. Always state which basis you're using — and keep it consistent with every other ratio you calculate.
How to calculate LTV for ecommerce, step by step
Here's the exact process to calculate LTV for an ecommerce store using your own data.
Step 1 — Get your AOV
Divide total revenue by total orders for a clean period. If you did $40,000 across 1,000 orders last month, AOV = $40,000 ÷ 1,000 = $40. Raising AOV is one of the fastest ways to lift LTV without touching acquisition — our guide to increasing AOV with AI covers the tactics that work for POD sellers.
Step 2 — Get purchase frequency
Divide total orders by unique customers over a year. If 500 customers placed 800 orders in twelve months, frequency = 800 ÷ 500 = 1.6 orders per year.
Step 3 — Estimate customer lifespan
Lifespan is the hardest input. The identity is lifespan ≈ 1 ÷ churn rate, where churn is the share of customers you lose each year. If you lose half your customers annually, lifespan is about two years; if you lose a quarter, it is about four.
Lifespan swings LTV more than any other input. Even a modest improvement in first-year retention — say from 30% to 40% — moves churn from 70% to 60% and stretches lifespan from roughly 1.4 years to roughly 1.7 years, a real LTV gain with zero change to acquisition cost.
Use your own cohort data first, and revisit it at least quarterly. Perspective AI's 2026 CLV guide recommends running a measurement loop that tracks LTV, repeat-purchase rate, AOV, and purchase frequency on a rolling cohort basis so you catch a decaying cohort while you can still act.
Step 4 — Apply your margin ratio
Multiply the three inputs, then by your gross-margin ratio. Using a 1.4-year lifespan (annual churn of ~71%): $40 × 1.6 × 1.4 × 0.60 = $53.76 in lifetime profit per customer. That is the number that should drive your acquisition budget — not the revenue-basis figure.
Cohort LTV vs. average LTV
A single average LTV number can hide important variation. MercuryMinds points out that a declining 12-month LTV across consecutive cohorts signals deteriorating customer quality — often caused by changes in acquisition channel mix, increased discount depth, or product issues affecting retention. Running cohort LTV means comparing customers acquired in Q1 versus Q3, for example, to see whether a discount-heavy campaign grew volume but crushed unit economics.
This cohort view also exposes channel quality. MercuryMinds notes that cohorts acquired at full price consistently outperform discount-acquired cohorts on LTV:CAC — which means the cheapest-to-acquire customer is rarely the most valuable one. Segment before you act on the average.
LTV is meaningless without CAC
An LTV number on its own tells you nothing. It only becomes a decision when you divide it by what you paid to acquire the customer — your customer acquisition cost.
LTV:CAC = LTV ÷ CAC
According to Nvecta, a ratio around 3:1 is the range most commonly cited as healthy, meaning a customer returns three times what it cost to land them. Ecommerce and retail businesses often land nearer 2.5:1 because customers are cheaper to reach but spend less over their lifetime, while SaaS companies often aim closer to 4:1 due to multi-year subscriptions. A ratio below 2:1 is a sign that acquisition costs need attention or that retention needs work to raise LTV. Wcart.io adds that a ratio far past 5:1 is not necessarily a win either — it often means you are holding back on marketing spend and leaving growth on the table.
The catch is that CAC has to be honest too. A paid CAC that only counts ad spend ignores tools, agencies, and freelancers. Use a blended number so your ratio isn't fiction.
Say your margin-basis LTV is $76.80 and your blended CAC is $15.63. Your ratio is $76.80 ÷ $15.63 ≈ 4.9:1 — healthy, and a signal you could likely spend more to grow.
What drives LTV higher for POD sellers
There are exactly four levers, as wcart.io frames it: raise order value, increase purchase frequency, extend the relationship, and protect margin. Acquiring more customers is not on the list.
- Second purchase rate. Burst Statistics notes that for ecommerce the biggest lever is usually driving the second purchase — customers who buy twice are far more likely to buy a third time. A Klaviyo post-purchase flow targeting first-time buyers is the highest-ROI retention move most POD stores can make.
- AOV. Bundles, upsells, and higher-price products all lift AOV without touching acquisition. See our AOV guide for AI-assisted tactics.
- Margin protection. Deep discounting grows volume but frequently destroys LTV:CAC, as the cohort data above shows. Our CRO techniques guide covers how to convert more traffic without racing to the bottom on price.
- Checkout completion. Every abandoned cart that recovers is a free order. Our average checkout completion rate benchmark shows where your store stands and what a realistic improvement looks like in LTV terms.
The mistakes that wreck an LTV number
Mixing bases. Comparing a revenue LTV to a profit-based CAC inflates the ratio. Keep both numerator and denominator on the same basis — ideally margin.
Forgetting variable costs beyond COGS. Gross margin subtracts product cost only. Shipping, payment fees, and fulfillment charges shrink it further — that's contribution margin, and it's the sharper lens for whether a channel is worth scaling. Our CRO techniques article and the net profit margin benchmark together map exactly what a realistic margin floor looks like for POD.
Averaging over a bimodal base. A single average LTV can hide a crowd of one-order buyers and a handful of whales. Segment by cohort and by acquisition channel before you act on the average.
Guessing lifespan. Lifespan swings LTV more than any other input. Derive it from real churn data, not a hopeful assumption — and revisit it quarterly as retention changes.
Ignoring discount-cohort contamination. Heavily discounted acquisition campaigns often produce customers with structurally lower LTV. Track cohort LTV by channel and offer type so a short-term ROAS win does not quietly poison your long-term unit economics. If you use Google Ads, note that missing ValueTrack tokens can produce NULL attribution, making Google-channel profit figures silently unreliable — see our Google Ads attribution guide for how to fix this.
Where the real number hides: per-order profit
Every input above depends on knowing your true margin per order — and that's exactly where spreadsheets fall apart. Production cost lives in Printify or Printful, ad spend in Meta and Google, fees in Stripe, orders in Shopify. An LTV built on a guessed margin is itself a guess.
PodVector connects Shopify, Meta Ads, Google Ads, Printify, and Printful, then computes your true per-order profit across all of them. That gives you the honest margin ratio the LTV formula needs — and it updates as your costs and prices change, so you are not recalculating from a stale spreadsheet each quarter.
It also gives you Victor, an AI employee that reads your connected data and — with your approval — executes actions on the Shopify side: repricing products to a target margin, creating or adjusting discounts, managing collections, or raising your free-shipping threshold. Victor reads your Meta and Google Ads data to surface where acquisition cost is quietly eroding LTV, but he does not touch your ad accounts. PodVector is not a dashboard; it is the profit layer that makes numbers like LTV trustworthy in the first place.
For POD sellers who also want to understand how fulfillment choice affects margin — and therefore LTV — our Printify and Printful comparison guide breaks down where each platform costs you more per order.
FAQs
What is a good LTV for ecommerce?
There's no single "good" LTV in dollars, because it depends entirely on your acquisition cost. What matters is the LTV:CAC ratio. Nvecta pegs the healthy range for ecommerce at around 2.5:1 to 3:1, with a ratio below 2:1 signaling that acquisition costs or retention need attention. A $50 LTV is excellent if your CAC is $15 and terrible if your CAC is $60.
What's the difference between LTV and CLV?
Nothing material — they measure the same thing. Nvecta explains that LTV often refers to a single average number for the whole business, while CLV is the term more commonly used when referring to an individual customer's value. In ecommerce conversations the two are used interchangeably.
Should I calculate LTV on revenue or profit?
Profit. A revenue-basis LTV overstates a customer's worth by whatever your costs are. Multiply your revenue LTV by your gross-margin ratio (or contribution-margin ratio, for a stricter view) so the number reflects money you actually keep. Burst Statistics notes that real CLV calculations adjust for gross margin so you measure profit, not revenue.
How do I find my customer lifespan?
Derive it from churn using lifespan ≈ 1 ÷ churn rate. Use your own cohort retention data as the primary source. Perspective AI recommends tracking repeat-purchase rate and purchase frequency on a rolling cohort basis so you catch deterioration early, rather than relying on a static lifespan estimate set once and forgotten.
How is LTV different from AOV?
AOV is a single order; LTV is the entire relationship. LTV equals AOV only if every customer buys exactly once. Raising your repeat-purchase rate lifts LTV without changing AOV at all — which is why Burst Statistics identifies driving the second purchase as the highest-leverage retention move in ecommerce.
Why does my LTV keep changing?
Because its inputs move. AOV shifts with pricing and bundling, frequency shifts with your product mix and email flows, and lifespan shifts with retention. Recalculate LTV at least quarterly, and always with a consistent margin basis so period-over-period comparisons mean something. If you use Klaviyo, scheduling post-purchase flows to drive repeat buys is one of the fastest ways to move purchase frequency — which feeds directly into a higher LTV.
Does fulfillment choice affect LTV?
Yes — through margin. The gross-margin ratio is a direct multiplier in the LTV formula, so a supplier that charges more per unit lowers your LTV even if your prices stay the same. Switching fulfillment providers or negotiating better base costs therefore raises LTV without touching acquisition at all. Our Fourthwall vs. Printify guide and the Printify and Printful POD seller guide both walk through where per-unit costs diverge and what that means for your margin ratio.