
Most LTV calculators online do one thing: multiply three numbers and show you a big figure. That figure feels good and tells you almost nothing, because it counts revenue you never keep. This page walks the real math, shows a worked example end to end, and pins down the one adjustment that turns a vanity number into a decision.
What an LTV calculator actually computes
LTV (lifetime value), also written CLV (customer lifetime value), is the same metric under two names — "LTV" dominates in ecommerce and DTC, "CLV" in finance and SaaS. It answers a single question: across the entire relationship, how much is one customer worth?
The core formula every calculator uses is:
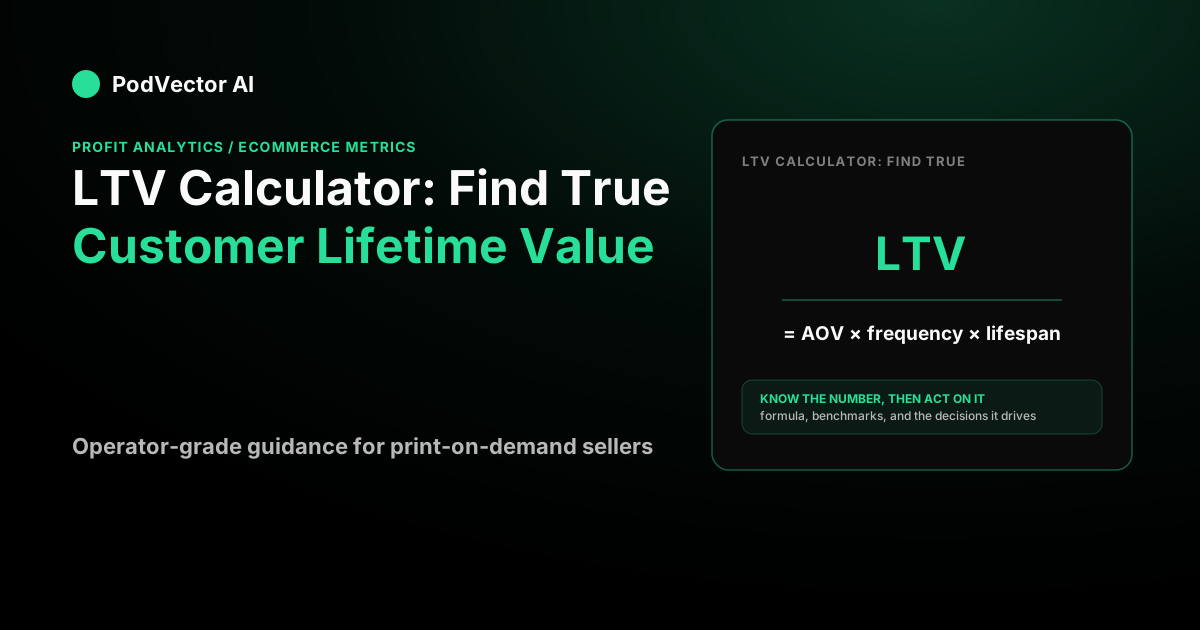
LTV = Average Order Value × Purchase Frequency × Customer Lifespan
That gives you a revenue-basis LTV. It's the number most free tools stop at, and it's the number that flatters you. You never bank revenue — you bank what's left after the product, shipping, and fees. So the honest version multiplies by your gross-margin ratio:
LTV = AOV × Purchase Frequency × Customer Lifespan × Gross-Margin Ratio
That's the whole trick. Everything else is knowing which inputs to trust and what to do with the answer. For the full family of related metrics — AOV, CAC, contribution margin — the ecommerce metrics guide defines each one against the same worked example.
The three inputs, and where each one lies to you
Average order value (AOV) is revenue ÷ orders over a period. It's the easiest input to pull and the easiest to misread, because an average hides the shape of your customers — a handful of whales can drag a mostly-small base upward. If you want to size AOV correctly before it feeds LTV, the average order value calculator breaks down the denominator traps.
Purchase frequency is orders ÷ unique customers over a window (usually a year). This is where print-on-demand and DTC stores most often overstate LTV — they assume repeat behavior they don't actually have yet. Pull it from your real order history, not hope.
Customer lifespan is how long, on average, a customer keeps buying. If you don't have years of cohort data, derive it from churn: lifespan is roughly 1 ÷ churn rate. Say a store loses eight percent of its customers each period — then 1 ÷ 0.08 ≈ 12.5 periods of expected lifespan. Lower churn stretches lifespan directly, which is why retention is the highest-leverage input in the whole formula.
A worked example, start to finish
Say you run a print-on-demand apparel store and want the margin-basis LTV of a typical customer. Your inputs, pulled from real data:
- AOV: $40 (a shirt that sells for forty dollars)
- Purchase frequency: 1.6 orders per year
- Customer lifespan: 2 years
- Gross margin: 60% — the $40 shirt costs $16 in blank garment, print, and base fulfillment, leaving $24
First, the revenue-basis number, so you can see the gap:
$40 × 1.6 × 2 = $128 in lifetime revenue per customer.
Now the margin-basis number, which is what you can actually spend:
$40 × 1.6 × 2 × 0.60 = $76.80 in lifetime gross profit per customer.
That's a $51 difference on one customer, and it's the entire reason margin-basis LTV matters. If you'd planned your ad budget around $128, you'd be spending against money that never existed. The $76.80 is real; the $128 is the invoice, not the paycheck.
LTV alone is useless — pair it with CAC
An LTV number by itself can't tell you whether to spend more or less. It only becomes a decision when you divide it by what a customer costs to acquire (CAC — customer acquisition cost). That ratio, LTV:CAC, is the single most-watched number in ecommerce unit economics.
Say your blended acquisition cost is $15.63 per new customer (total sales and marketing spend ÷ new customers). Then:
$76.80 ÷ $15.63 = 4.9:1
The widely cited rule of thumb is that a healthy LTV:CAC sits around 3:1, with the practical range for DTC ecommerce running roughly between two-and-a-half to one and four to one on a margin basis, according to TrueProfit's benchmark analysis. A ratio well above that range isn't automatically great — it can mean you're under-investing in growth and leaving acquisition on the table. Below one to one means each customer loses you money.
One rule that keeps the ratio honest: the margin definition inside your LTV must match the one you use for acquisition. If LTV counts gross profit but you compare it to a CAC computed on revenue, the ratio will silently overstate your health. Keep both on the same basis.
The mistakes that break LTV calculators
Revenue basis vs profit basis. The most common error, covered above: quoting the $128 revenue figure and treating it like spendable value. Always state which basis you're on, and use margin for any decision that touches spend.
Averages hiding the distribution. A single "$76.80 LTV" can mask a bimodal base — many one-order buyers plus a few loyal repeat customers. Segment before you act on the average, or you'll set one acquisition budget for two completely different customers.
Churn assumptions dressed up as facts. Lifespan derived from 1 ÷ churn is only as good as your churn number. If you guess churn low, lifespan and LTV both inflate. Use your actual cohort retention where you have it.
Frequency borrowed from someone else's store. Repeat rate varies wildly by category. A benchmark from a subscription brand will wreck a POD apparel model. Use your own order history.
The through-line is that LTV is downstream of costs you might not be tracking cleanly — COGS, shipping, fees, returns. If those are fuzzy, your margin ratio is fuzzy, and so is every LTV number built on it. The same discipline applies to the ad side: a great-looking ROAS can hide a losing campaign once margin enters, which is why blended ROAS and MER and a clean cost-per-order figure belong next to LTV in the same view.
From calculator to continuous number
A calculator gives you a snapshot from inputs you type in by hand. The problem is that AOV, frequency, churn, and margin all drift, and a number you computed last quarter quietly goes stale. The useful version of LTV is one that recomputes itself as orders land, because that's the only way LTV:CAC stays a live guardrail instead of a slide in an old deck.
That requires per-order profit that's actually correct — every order's real product cost, shipping, payment fees, and fulfillment netted out, not an assumed flat margin. PodVector connects Shopify, Meta Ads, Google Ads, Printify, and Printful, and computes true per-order profit from those live connections. Victor, its AI employee, analyzes that data and — with your approval — acts on it Shopify-side; he reads your ad data to inform the picture but does not touch your ad account. If you want LTV and its inputs computed off real numbers instead of typed-in guesses, start with PodVector.
Once profit-basis LTV is trustworthy, the next lever is usually acquisition efficiency and ad fatigue — the ad frequency calculator is where a lot of stores find CAC quietly rising.
FAQs
What is the simplest LTV formula?
LTV = Average Order Value × Purchase Frequency × Customer Lifespan. That gives revenue-basis lifetime value. Multiply by your gross-margin ratio to get profit-basis LTV, which is the number you can actually spend against acquisition cost.
What's the difference between LTV and CLV?
None — they're the same metric. "LTV" (lifetime value) is more common in ecommerce and DTC; "CLV" (customer lifetime value) shows up more in SaaS and finance. Some people use "CLV" to signal a predictive, modeled version, but the underlying idea is identical.
Should I use revenue or profit in my LTV?
Profit, for any decision. Revenue-basis LTV overstates what a customer is worth because it ignores COGS, shipping, and fees. In the worked example above, revenue LTV was $128 while margin LTV was $76.80 — a difference big enough to turn a profitable ad budget into a losing one.
What's a good LTV:CAC ratio?
Around 3:1 is the common benchmark, with DTC ecommerce typically healthy in a range near two-and-a-half to one up to four to one on a margin basis, per TrueProfit. Much higher can signal under-investment in growth; below one to one means you lose money on each customer.
How do I estimate customer lifespan without years of data?
Derive it from churn: lifespan ≈ 1 ÷ churn rate. If roughly a tenth of customers stop buying each period, expected lifespan is about ten periods. It's an estimate, so refine it with real cohort retention as your history builds.
Does raising AOV or improving retention increase LTV more?
Both help, but retention usually wins because it works through lifespan, which multiplies the whole formula. Cutting churn stretches how long every customer keeps buying, lifting LTV without spending another dollar on acquisition. Raising AOV lifts one input; retention lifts the multiplier on all of them.