
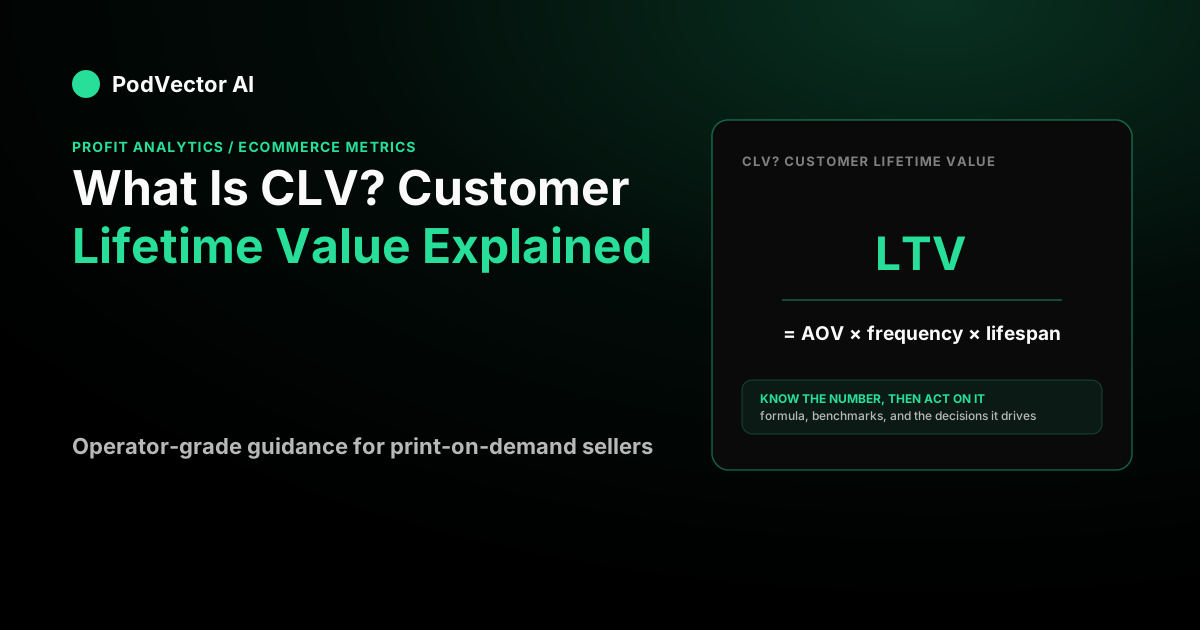
What CLV actually measures
CLV — sometimes written CLTV or LTV — is the value one customer brings over the whole time they buy from you. LTV and CLV are the same metric; "LTV" is more common in direct-to-consumer ecommerce, "CLV" in finance and SaaS. Use whichever your team already says.
The point of the number is to stop you from judging customers one order at a time. A shopper who spends forty dollars once and a shopper who spends forty dollars every quarter for three years look identical on their first receipt. CLV separates them.
Once you know what a customer is worth over their lifetime, you know how much you can afford to spend acquiring one. That single comparison — value in versus cost to acquire — is where CLV earns its keep. It sits alongside the other numbers in our ecommerce metrics guide, and it is the one that ties acquisition spend to long-term profit.
The CLV formula (and the version that lies)
There are two formulas floating around, and they can differ by nearly half. Know which one you are looking at.
The revenue-basis formula is the one you see most:
CLV = Average order value × Purchase frequency × Customer lifespan
The margin-basis formula — the honest one — multiplies that by your gross margin, so you count profit instead of top-line sales:
CLV = AOV × Purchase frequency × Customer lifespan × Gross-margin ratio
Revenue CLV tells you how much money passes through the register. Margin CLV tells you how much you keep. When you later compare CLV to acquisition cost, only the margin version gives an answer you can bank.
A worked example
Say you run a print-on-demand apparel store. Your average order value is forty dollars, a typical customer places about one and a half orders a year, they stick around for two years, and your gross margin is sixty percent. Plug those in:
Revenue basis: $40 × 1.5 × 2 = $120.
Margin basis: $120 × 0.60 = $72.
Same customer, two very different numbers. The first says a customer is "worth $120"; the second says the profit you actually pocket is $72. If your acquisition cost were, say, $30, the revenue version makes you look four times more efficient than you are, while the margin version tells the truth: a little over two dollars of profit per dollar spent.
Some teams push further and use contribution margin — profit after shipping, payment fees, and pick-and-pack, not just product cost. That lands even lower and is the strictest read. The rule is simple: pick one basis and hold it, or your CLV and your cost numbers will quietly disagree. Because most POD margins are thin once shipping and fees land, our dropshipping profit margins breakdown is worth a look before you trust a sixty-percent figure.
The two ways to measure CLV: historic vs. predictive
There are two flavors, and they answer different questions.
Historic CLV looks backward: it sums what an existing customer has already spent (or the margin they have already produced). It is factual and easy — just add up their order history. Its weakness is that it says nothing about a customer who is only three months in.
Predictive CLV looks forward: it estimates how much a customer will spend based on early behavior, purchase frequency, and churn patterns. It is what you need for acquisition decisions, because you are deciding how much to pay for customers who have not finished buying yet. Stripe's overview of CLV frames the same split — history is what happened, prediction is what to budget against.
Most stores start with historic CLV because the data is sitting in their orders table, then layer prediction on once they have enough repeat-purchase history to model it.
Deriving lifespan from churn
The shakiest input in the formula is "customer lifespan." Two years is a guess unless you can back it out of data. You can, from your churn rate:
Customer lifespan ≈ 1 ÷ churn rate
If eight percent of your customers lapse each period, the average lifespan is 1 ÷ 0.08 = 12.5 periods. This matters because lifespan is a lever, not a fact. Cut churn and lifespan stretches, and CLV climbs with it — no change to acquisition cost required. That is why retention work often beats acquisition work dollar for dollar, a point we make at length in the piece on why an unusually high LTV can be a warning sign rather than only good news.
What is a good CLV?
Here is the honest answer: there is no universal "good" CLV dollar figure — a $72 CLV is excellent for a $10 impulse product and catastrophic for a $2,000 mattress. CLV in isolation is meaningless. It only becomes a verdict when you divide it by what it cost to acquire the customer.
That ratio is LTV:CAC (lifetime value to customer acquisition cost), and it is the real answer to "what is a good CLV."
LTV:CAC = Customer lifetime value ÷ Customer acquisition cost
The widely cited benchmark is 3:1 — for every dollar spent acquiring a customer, you want about three dollars of lifetime value back. Wall Street Prep notes that "the target LTV/CAC ratio is 3.0x, which means that for each dollar spent to acquire customers, the company should be receiving $3.00 of value in return."
Real-world numbers cluster near there but skew higher for retention-driven businesses. A 2026 cross-industry benchmark set from Digital Applied puts the median LTV:CAC at 3.4x and the top quartile at 5.6x, with subscription-style DTC models sitting even higher because repeat revenue compounds.
Read the ratio like this:
- Below 1:1 — you lose money on every customer. Unsustainable.
- Around 3:1 — healthy; acquisition pays for itself with room to spare.
- Above 5:1 — profitable, but often a sign you are under-spending on growth and leaving customers on the table.
Two cautions. First, use margin-basis CLV in the numerator and a fully-loaded CAC in the denominator, or the ratio is fiction. Second, a high ratio driven by a handful of whales can hide a mass of one-and-done buyers — averages conceal distributions, so segment before you celebrate.
How to raise CLV
Three levers move CLV, and they are not equally easy.
Raise average order value. Bundles, volume discounts, and free-shipping thresholds lift the AOV term directly. This is the fastest lever but the smallest, because it only touches one order.
Increase purchase frequency. Getting a customer to buy three times a year instead of one and a half doubles the frequency term — and it flows straight through to CLV with no new acquisition cost. Email, restock nudges, and genuinely good products do this.
Extend lifespan by cutting churn. Because lifespan is roughly 1 ÷ churn, small churn reductions produce outsized CLV gains. This is usually the highest-leverage and the hardest.
Notice that two of the three levers are retention, not acquisition. That is the quiet lesson of CLV: the cheapest growth is the customers you already paid for. Site experience feeds all three — engaged visitors buy more and come back, which is why time on site tracks alongside the frequency and lifespan terms.
Where the real profit hides
CLV is only as trustworthy as the margin you feed it — and margin is exactly where most stores are fuzziest. Your gross-margin ratio depends on COGS, shipping, payment fees, returns, and the ad spend allocated to each order. Get any of those wrong and your CLV, your LTV:CAC, and your acquisition budget are all wrong together. If you are still estimating margin, the net profit margin calculator walks through the full cost stack.
This is the gap PodVector closes. It connects your Shopify, Meta Ads, Google Ads, Printify, and Printful accounts and computes true per-order profit — the real margin that belongs in a margin-based CLV, not a guessed sixty percent. Victor, its AI employee, reads that live data, surfaces which customers and products actually earn their keep, and proposes Shopify-side moves you approve. He reads your ad data but does not touch your ad account. If you want CLV built on real numbers instead of round ones, connect your store to PodVector.
FAQs
What is the difference between CLV and LTV?
None — they are the same metric under two names. "CLV" (customer lifetime value) is more common in finance and SaaS; "LTV" (lifetime value) dominates in direct-to-consumer ecommerce. Both mean the total value a customer generates over their relationship with you. If a report mixes the terms, do not assume a hidden distinction; check the basis (revenue vs. margin) instead, because that is where the real differences live.
Should I calculate CLV on revenue or profit?
On profit, using your gross-margin (or, stricter, contribution-margin) ratio. Revenue-basis CLV overstates a customer's worth by whatever your margin gives up — on a sixty-percent-margin store, revenue CLV is roughly one and two-thirds times the margin figure. The moment you compare CLV to acquisition cost, only the margin version yields an honest LTV:CAC ratio.
What is a good LTV:CAC ratio?
Around 3:1 is the standard health benchmark, meaning three dollars of lifetime value per dollar of acquisition cost, per Wall Street Prep. Below 1:1 you are losing money on acquisition; well above 5:1 often signals you could spend more aggressively on growth. Match the basis on both sides: margin-based CLV over fully-loaded CAC.
How do I estimate customer lifespan?
Back it out of your churn rate: lifespan ≈ 1 ÷ churn. A store losing eight percent of customers per period has an average lifespan near twelve and a half periods. This is more defensible than guessing "two years," and it makes the retention lever obvious — lower churn, longer lifespan, higher CLV.
Can CLV be negative?
Effectively, yes. If a customer's acquisition and service costs exceed the margin they ever produce — common with heavy discounting, high return rates, or one-and-done buyers acquired at a steep CAC — their lifetime value is negative. This is why segmenting matters: a healthy average CLV can hide a segment you are paying to keep.