
Contribution margin is one of the most useful numbers you can pull from your store, and it takes about a minute to calculate once you know which costs count. This guide walks the exact formula, a full ecommerce example with every variable cost included, and how to find the contribution margin ratio. It also shows the mistake most calculators skip: forgetting shipping, fees, and ad spend.
What contribution margin actually measures
Contribution margin is the money left from a sale after you pay every cost that scales with volume. According to Intuit, it represents the portion of revenue that "contributes" to covering fixed costs and then to profit.
Think of it as a per-sale profit engine. Each order throws off some cash, and that cash pile has one job first: pay the rent, salaries, and software that do not change whether you sell ten units or ten thousand. Whatever is left after fixed costs is profit.
The key word is variable. A cost is variable if it goes up when you sell more and down when you sell less. Fixed costs stay flat in the short run. Contribution margin only subtracts the variable ones, which is exactly what makes it different from gross margin or net margin.
How to find contribution margin: the formula
The formula is short:
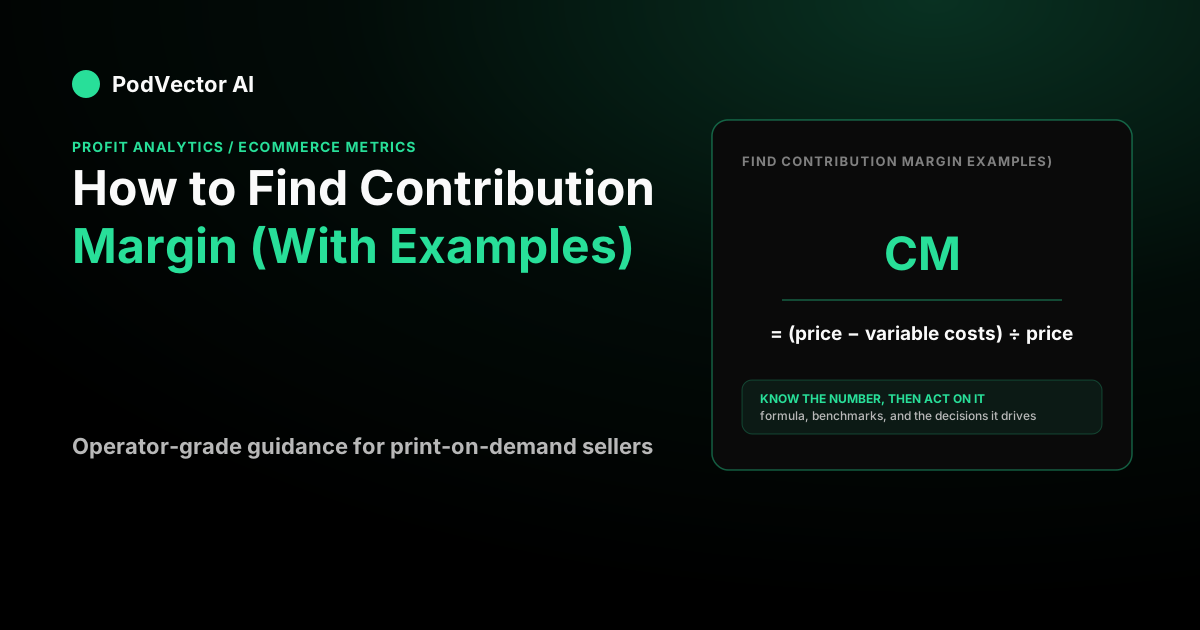
Contribution margin = Revenue − Variable costs
You can run it two ways, and both are correct:
- Per unit (or per order): selling price − variable cost per unit
- Total (over a period): total revenue − total variable costs
Per-unit is the one you reach for when deciding whether a product is worth selling or how low you can discount. Total is the one that feeds your break-even math. They answer the same question at different zoom levels.
Step 1: List every variable cost
This is where most people go wrong. They subtract the product cost and stop. A real order has a stack of variable costs. If you run a print-on-demand or dropshipping store, the honest list looks like this:
- Cost of goods sold (the product itself)
- Shipping paid to the carrier
- Payment processing fees
- Pick, pack, and fulfillment labor
- Variable ad spend allocated to that order
Leave any of these out and your contribution margin looks healthier than it is. That gap is why a store can post a strong "margin" on paper and still run out of cash.
Step 2: Subtract them from revenue
Say you sell a printed hoodie for $40. Here is the full variable-cost stack for one order:
| Line | Amount |
|---|---|
| Revenue | $40.00 |
| − Cost of goods (blank + print) | −$16.00 |
| − Shipping | −$5.00 |
| − Payment processing (4%) | −$1.60 |
| − Pick and pack labor | −$1.40 |
| = Contribution margin (before ads) | $16.00 |
So this order's contribution margin, before you spend a dollar on advertising, is $16.00. That is the cash it hands you to cover fixed costs and profit.
Notice how different that is from the naive version. If you only subtracted the $16 product cost, you would think you had $24 to work with. The real number is a third smaller once shipping, fees, and labor enter. The contribution margin definition from Wall Street Prep is explicit that all variable costs belong in the subtraction, not just the cost of the product.
How to find the contribution margin ratio
The ratio expresses the same thing as a percentage of revenue, which makes it easy to compare products with different price tags.
Contribution margin ratio = Contribution margin ÷ Revenue × 100
Using the hoodie: $16.00 ÷ $40.00 = 40%. Every dollar of sales leaves forty cents after variable costs.
That percentage is more portable than the dollar figure. A $40 hoodie at a 40% ratio and a $20 mug at a 40% ratio behave the same way per dollar sold, even though their unit margins differ. When you are comparing categories or setting discount floors, the ratio is usually the number you want. Understanding how a metric like this connects to pricing is the same skill covered in our guide to the difference between markup and margin, where the same $16 cost and $40 price produce a 150% markup but a 60% gross margin.
Where advertising fits: the layer most guides skip
Here is the part the ranking calculators leave out. For most online stores, the biggest variable cost is not the product — it is customer acquisition. If you spend on Meta or Google to win the sale, that ad cost is variable too, and it belongs in a fuller contribution number.
Continuing the hoodie example, say you allocate $10.00 of ad spend to that order (a 4.0 return on ad spend on $40 revenue):
| Line | Amount |
|---|---|
| Contribution margin before ads | $16.00 |
| − Allocated ad spend | −$10.00 |
| = Contribution margin after ads | $6.00 |
Now the story changes. The order that looked like it threw off $16 actually leaves $6 once acquisition is paid. The ratio drops from 40% to 15%. That $6 is the number that has to cover your fixed costs, so knowing it is the difference between scaling profitably and scaling into a hole.
This is also why break-even return on ad spend matters so much: the lower your contribution margin ratio, the higher the return you need just to avoid losing money. If you want to pressure-test the ad side of this, our ROAS calculator walks the exact relationship between your margin and the return you need to clear.
Contribution margin vs gross margin vs net margin
These three get confused constantly, and the difference is entirely about which costs you subtract.
- Gross margin subtracts only the cost of goods. On the hoodie, that is ($40 − $16) ÷ $40 = 60%.
- Contribution margin subtracts all variable costs — goods plus shipping, fees, labor, and ad allocation. On the hoodie, 40% before ads and 15% after.
- Net margin subtracts everything, including fixed costs like rent and salaries. It is the company-level scoreboard.
Gross margin tells you whether a product is worth making. Contribution margin tells you whether it is worth selling through this channel at this cost. Net margin tells you whether the business as a whole made money. All three matter, but only contribution margin answers the day-to-day question "should I scale this?" You can see how these fit alongside the rest of your numbers in our ecommerce metrics guide.
Using contribution margin to find break-even
Once you have the per-order number, break-even is a single division. Break-even is the point where total contribution margin exactly covers your fixed costs, so profit is zero.
Break-even units = Fixed costs ÷ Contribution margin per unit
Say your fixed costs are $4,000 a month and your after-ads contribution margin is $6.00 per order. You need $4,000 ÷ $6.00 = 667 orders a month just to break even. Every order past 667 is profit at $6 a pop.
That single calculation reframes a lot of decisions. Raise your contribution margin by $2 — say, by cutting print cost or shipping — and your break-even drops to 500 orders. The leverage is real, and it comes straight from the number you just learned to find.
Common mistakes when finding contribution margin
Counting only the product cost. The most frequent error. Shipping, processing fees, and fulfillment labor all scale with volume and all belong in the subtraction.
Treating ad spend as a fixed marketing line. For acquisition-driven stores, ad spend per order is variable and materially changes the number. Track a before-ads and an after-ads version so you know both.
Mixing up which customers to segment. Averages hide a lot. New-customer orders often carry the full ad cost while repeat orders carry almost none, so a blended contribution margin can mask two very different economics. Segmenting buyers — for example with RFM analysis — keeps the average from lying to you.
Confusing margin with markup. A 60% margin and a 60% markup are not the same number. Keep the two straight before you set prices.
Let true per-order profit do the math for you
Finding contribution margin by hand is easy for one order. Doing it across every SKU, channel, and ad campaign — with real fees and real shipping — is where it gets tedious and error-prone.
PodVector connects your Shopify, Meta Ads, Google Ads, Printify, and Printful data and computes true per-order profit, so the contribution margin math above is done for you on live orders instead of a spreadsheet. Victor, the AI employee inside it, reads that data, flags where your margins are thinning, and proposes moves you approve. Start with PodVector and see your real per-order numbers.
FAQs
What is the formula to find contribution margin?
Contribution margin = revenue − variable costs. Use selling price minus variable cost per unit for a single product, or total revenue minus total variable costs for a period. The result is the money each sale leaves to cover fixed costs and profit.
How do you find the contribution margin ratio?
Divide contribution margin by revenue and multiply by 100. If an order produces $16 of contribution margin on $40 of revenue, the ratio is $16 ÷ $40 × 100 = 40%. The ratio lets you compare products with different prices on equal footing.
What counts as a variable cost?
Any cost that rises when you sell more and falls when you sell less: the cost of goods, shipping, payment processing fees, fulfillment labor, and variable ad spend. Costs that stay flat regardless of volume — rent, salaries, software subscriptions — are fixed and are not subtracted when finding contribution margin.
Is contribution margin the same as gross margin?
No. Gross margin subtracts only the cost of goods sold. Contribution margin subtracts every variable cost, including shipping, fees, labor, and ad spend. That is why a product can show a healthy gross margin but a much thinner contribution margin once the full cost stack is included.
Should advertising be included in contribution margin?
If ad spend scales with your orders, yes — it is a variable cost. Many stores track two versions: contribution margin before ads (to judge the product) and contribution margin after ads (to judge whether acquiring the customer paid off). Both are useful; just be clear which one you are quoting.
Why does contribution margin matter for break-even?
Break-even units equal fixed costs divided by contribution margin per unit. The bigger your per-order contribution margin, the fewer orders you need to cover fixed costs, and the sooner every extra sale becomes profit. It turns a vague pricing question into one division.