
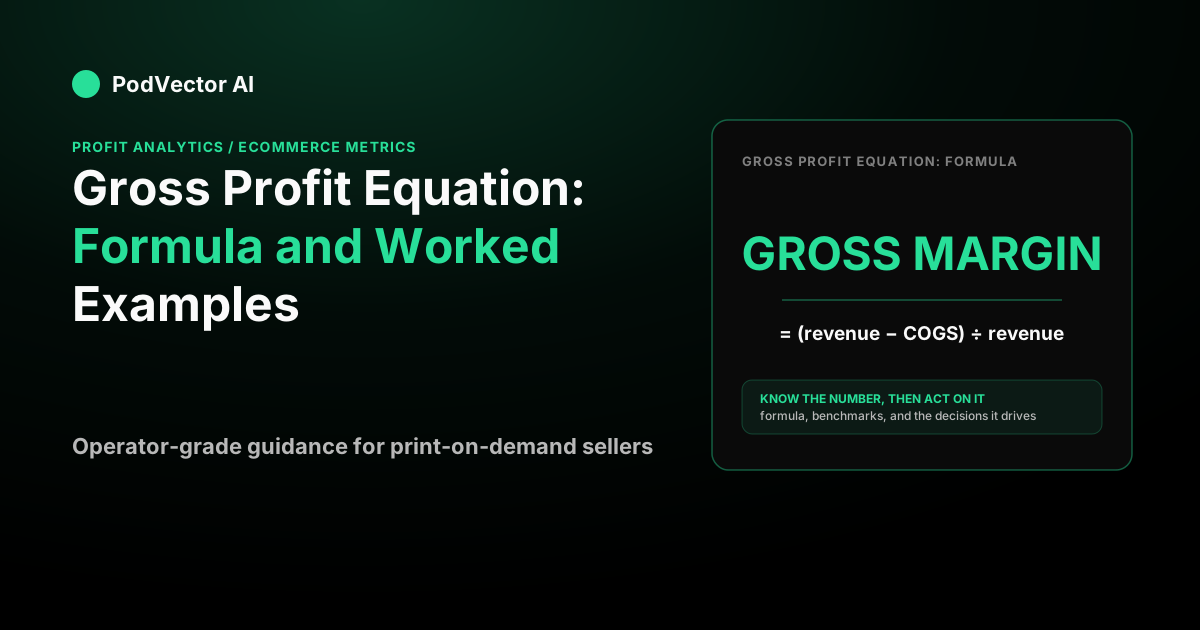
What the gross profit equation actually says
Gross profit answers one question: after you pay for the product itself, how much is left? The formula is deliberately narrow.
Gross Profit = Revenue − COGS
Revenue is your top line for the period. COGS is only the direct cost of the goods you sold — materials, the item's production or purchase cost, and the labor tied to making it. Rent, salaries, software, and ad spend are not in COGS, so they never touch this equation.
That narrowness is the point. Gross profit isolates whether the product itself makes money before the rest of the business gets involved. If you want the full path from top line to take-home, our ecommerce metrics guide walks the whole chain.
Gross profit vs. gross margin
Gross profit is a dollar figure. Gross margin is that same gap expressed as a percentage of revenue, and it is what lets you compare orders of different sizes.
Gross Margin % = (Revenue − COGS) ÷ Revenue × 100
Say one order brings in $40 of revenue at $16 of product cost. Gross profit is $40 − $16 = $24, and gross margin is $24 ÷ $40 = 60%. Now say a bigger order brings in $120 at $48 cost: gross profit is $120 − $48 = $72, but the margin is still $72 ÷ $120 = 60%. The dollars differ; the efficiency is identical.
That is why margin is the better yardstick for comparing products or periods. Two orders can post very different gross profit at the same gross margin — or the same gross profit at very different margins. If you want to go deeper on the top-line half of the equation, see how sales revenue is defined and calculated.
A worked example: one print-on-demand order
Formulas stick when you run real numbers. Say you run a print-on-demand apparel store and want the gross profit on one average order.
- Revenue (what the customer pays): $40.00
- COGS (blank garment + printing + the supplier's base fulfillment charge): $16.00
Plug it in: $40.00 − $16.00 = $24.00 gross profit. As a margin, that is $24 ÷ $40 = 60%. So sixty cents of every sales dollar survives the product cost — before anything else is paid.
Scaling the equation to a month
The equation works the same on aggregates. Say that same store does 1,000 orders in a month at that $40 average, so revenue is 1,000 × $40 = $40,000 and COGS is 1,000 × $16 = $16,000.
Monthly gross profit is $40,000 − $16,000 = $24,000, still a 60% gross margin. Nothing changes but the scale — which is exactly why gross margin travels cleanly from one order to a full quarter.
The profit the gross profit equation hides
Here is what most explainers skip: gross profit is not the money you keep. It is the money left before shipping, payment fees, fulfillment labor, ads, and overhead. On a print-on-demand order, those variable costs are large.
Keep going with the same $40 order that had $24 of gross profit, and subtract the other variable costs:
- Carrier shipping: −$5.00
- Payment processing (say four percent of $40): −$1.60
- Pick-and-pack labor: −$1.40
That leaves $24.00 − $5.00 − $1.60 − $1.40 = $16.00. This figure — revenue minus all variable costs except ads — is your contribution margin, and here it is $16 ÷ $40 = 40% of revenue, not 60%. The gross profit equation never saw the shipping or the fees.
Now subtract advertising. Say you spend enough on Meta and Google to run a 4.0 return on ad spend, so ads cost about $40 ÷ 4.0 = $10 per order. Contribution margin after ads is $16.00 − $10.00 = $6.00 — about $6 ÷ $40 = 15% of the order. That $6, not the $24 of gross profit, is what actually funds rent, salaries, and profit.
This gap is where thin-margin stores quietly lose money while their gross margin looks healthy. Acquisition cost is the usual culprit, and it compounds fast — our breakdown of customer acquisition cost and marketing spend shows how a healthy-looking gross margin turns into a loss once ads are priced in. If you want the equation that sits one level below gross margin, operating margin is the next line down.
What belongs in COGS (and what doesn't)
The gross profit equation is only as honest as your COGS. Include too little and gross profit looks inflated; include too much and it looks worse than reality.
Belongs in COGS: the product's direct cost — raw materials or wholesale price, the production or printing cost, and direct fulfillment labor baked into the item. For print-on-demand, that is the blank plus the print plus the supplier's per-item base charge.
Does not belong in COGS: rent, salaries not tied to production, software subscriptions, and advertising. Those are operating expenses that live below the gross profit line. The one rule that matters most: pick a definition and hold it. If the supplier's flat print fee sits in COGS one month and in "fulfillment" the next, your gross margin will jump for no real reason.
Common mistakes with the gross profit equation
Confusing markup and margin. A $16 product sold for $40 is a 150% markup over cost ($24 ÷ $16) but a 60% margin on price ($24 ÷ $40). Same $24 gap, two very different numbers — quoting one when you mean the other is a classic pricing error.
Treating gross profit as take-home. As the worked example showed, $24 of gross profit became $6 after variable costs on that order. Gross profit tells you if a product is worth making; it does not tell you if the business made money.
Averaging away the losers. A single blended gross margin can hide a few SKUs selling below cost while your winners carry them. Run the equation per product, not just store-wide, before you trust the average.
Where per-order profit gets easier
The gross profit equation is simple; keeping the inputs accurate across live orders is not. Product costs, shipping, fees, and ad allocation all move, and most tools only show one slice.
PodVector connects Shopify, Meta Ads, Google Ads, Printify, and Printful, then computes true per-order profit — not just gross profit, but the contribution left after fees, shipping, and ads. Victor, its AI employee, analyzes that live data and proposes moves, executing approved changes on the Shopify side; he reads your ad data but does not touch your ad account. It is an employee, not a dashboard.
If profit is the goal, retention is the multiplier — a repeat buyer earns gross profit again with no new acquisition cost, which our customer retention rate calculator helps you quantify. When you want per-order profit computed from your own connected data instead of a spreadsheet, start with PodVector.
FAQs
What is the gross profit equation?
Gross profit equals revenue minus cost of goods sold: Gross Profit = Revenue − COGS. Revenue is total sales for the period; COGS is the direct cost of the goods sold, excluding overhead and advertising. The result is the money left to cover everything else.
How do you calculate gross profit margin from gross profit?
Divide gross profit by revenue and multiply by 100: Gross Margin % = Gross Profit ÷ Revenue × 100. For a $40 order with $16 of product cost, gross profit is $24 and the margin is $24 ÷ $40 = 60%. Margin lets you compare orders of different sizes on equal footing.
Is gross profit the same as net profit?
No. Gross profit subtracts only COGS. Net profit subtracts everything — shipping, fees, ads, salaries, rent, and taxes. On the worked $40 order, $24 of gross profit shrank to about $6 of contribution once variable costs and ads were included, and net profit sits lower still after fixed costs.
Does advertising go into the gross profit equation?
No. Advertising is an operating expense, not a cost of goods sold, so it never appears in the gross profit calculation. That is precisely why a store can post a strong gross margin and still lose money once ad spend is counted — the equation simply cannot see it.
What is a good gross margin?
It depends entirely on the business model, so there is no universal number worth quoting. What matters more is whether your margin clears break-even after ads: the return on ad spend you must hit just to avoid a loss is roughly 1 ÷ your contribution-margin ratio. Track that alongside gross margin rather than chasing a benchmark.