
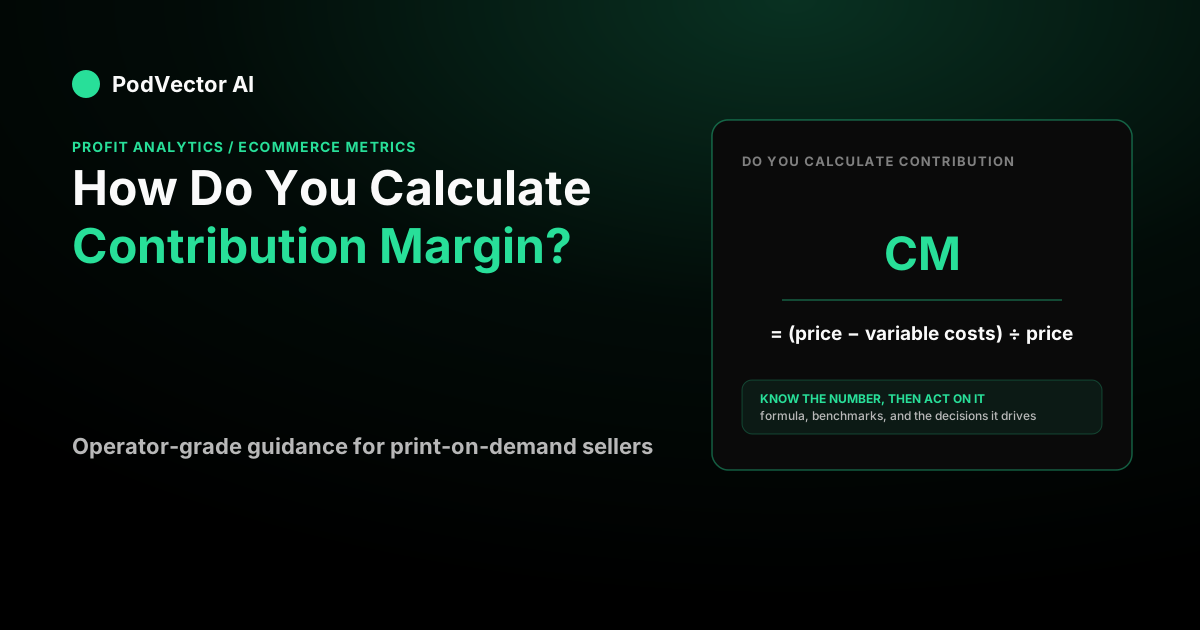
The formula fits on a napkin. The hard part is knowing which costs count as variable, and most guides quietly skip half of them. This walkthrough gives you the exact steps, a full per-order example for a print-on-demand store, and the reason contribution margin is really a profit question in disguise.
The contribution margin formula
There is one core equation, and everything else is a variation of it.
- Contribution margin (dollars):
Revenue − Variable Costs - Contribution margin ratio (percent):
(Revenue − Variable Costs) ÷ Revenue × 100
"Variable costs" means every cost that moves with volume — costs you only pay because you made and sold that unit. If you sell one more shirt, which costs go up? Those are your variable costs. Rent and salaries don't move, so they stay out of this calculation.
That distinction is the whole game. Contribution margin deliberately ignores fixed costs so you can see how much each sale contributes toward covering them. According to Wayflyer's 2026 guide, contribution margin is more complete than gross margin for ecommerce brands because it accounts for all variable costs — including fulfillment, transaction fees, and direct marketing spend — not just COGS. For a fuller breakdown of how this metric connects to everything downstream, see our net profit margin benchmark guide.
How do you calculate contribution margin, step by step
Work it per unit first — it's the most useful view for pricing and product decisions.
- Start with the selling price of one unit or order. This is your revenue for that sale.
- List every variable cost tied to that sale. Product cost, shipping, payment fees, fulfillment labor, and any per-unit ad allocation.
- Add the variable costs together.
- Subtract that total from the price. What's left is your contribution margin in dollars.
- Divide by the price and multiply by 100 to get the ratio.
A full per-order example
Say you run a print-on-demand apparel store and want the contribution margin on your average order. Here's a realistic per-order cost stack:
| Line | Amount |
|---|---|
| Revenue (one order) | $40.00 |
| − Product cost (blank garment + print) | −$16.00 |
| − Shipping | −$5.00 |
| − Payment processing (four percent of $40) | −$1.60 |
| − Pick and pack / fulfillment labor | −$1.40 |
| = Contribution margin (CM2) | $16.00 |
The arithmetic: $40 − $16 − $5 − $1.60 − $1.40 = $16.00. So this order contributes $16 toward fixed costs and profit.
Notice how far that is from gross profit. If you only subtracted the $16 product cost, you'd think you had $24 to work with. The extra $8 of shipping, fees, and fulfillment is real money that leaves with every order — and it's exactly what the thin definitions leave out. As Onramp Funds notes, contribution margin helps you identify areas like shipping or packaging where you can cut costs.
Per-unit vs total contribution margin
You can run the same math on your whole business instead of one order. Just swap in totals: Total Revenue − Total Variable Costs.
Say that same store did a thousand orders in a month. Total revenue is 1,000 × $40 = $40,000, and total variable costs are 1,000 × $24 = $24,000, so total contribution margin is $40,000 − $24,000 = $16,000. Per-unit and total always agree when your unit economics are consistent — the per-unit view is just easier to reason about for pricing and product decisions.
Contribution margin ratio
The ratio turns dollars into a percentage so you can compare products of different prices.
Using the example above: $16 ÷ $40 × 100 = 40%. Forty cents of every dollar this store collects survives its variable costs. A $10 product and a $200 product can now be compared on equal footing — the one with the higher ratio contributes more per dollar of sales, regardless of price tag.
The ratio is also the number your break-even math needs, which we'll get to below. If you want to see how margin ratios translate into checkout behavior, the average checkout completion rate for ecommerce shows how conversion rate interacts with per-order economics.
Which costs actually count as variable?
This is where calculations quietly go wrong. A cost is variable if it scales with each unit sold. Common ecommerce variable costs:
- Cost of goods sold (COGS): the product itself — materials, manufacturing, or a supplier's per-item charge. For POD sellers, this is the blank garment plus the print fee from Printify or Printful.
- Shipping and last-mile carrier fees you pay to get the order out. For POD stores, this is the rate your fulfillment partner charges per shipment. See our Printful shipping rates guide for current cost benchmarks.
- Payment processing fees, usually a percentage of the order plus a flat cent amount.
- Pick, pack, and fulfillment labor charged per order.
- Returns and refund costs — reverse logistics, restocking, and lost margin on returned units all scale with volume and belong in your variable cost stack.
- Per-order ad spend, if you allocate advertising down to the unit (more on this next).
Fixed costs — rent, salaries, software subscriptions, a base agency retainer — stay out. They don't change whether you sell ten orders or ten thousand this month, so including them would defeat the purpose. Be careful with "semi-fixed" or step costs like a second warehouse: fixed within a range, then they jump.
Don't forget returns
Returns are a frequently missed variable cost. According to ask-luca.com, return rates can surge significantly after peak seasons, creating delayed "margin surprises" that compress reported profitability weeks after the transactions occurred. For POD sellers, a returned item typically cannot be restocked, making the full product cost a loss. Build a return-rate assumption into your variable cost stack, especially if you run heavy promotional periods.
Contribution margin tiers: the ecommerce version
Most articles give you one number. Real operators track contribution margin in tiers, because different decisions need different cost stacks netted out.
- CM1 subtracts only COGS from revenue — essentially gross profit. In the example,
$40 − $16 = $24, a sixty percent CM1 ratio. - CM2 subtracts COGS plus all the other non-ad variable costs (shipping, fees, fulfillment). That's the
$16and forty percent we calculated — the honest pre-advertising number. - CM3 subtracts advertising too. If you allocate
$10of ad spend to this order,$16 − $10 = $6, a fifteen percent CM3 ratio.
CM3 is the one that tells you whether an order actually made money after you paid to acquire the customer. According to StoreHero's formula guide, if you are scaling paid ads, targeting at least a 35% CM3 ratio is the threshold for scaling profitably. Because CM3 depends on acquisition cost, it ties directly to how efficiently your Meta and Google campaigns convert spend into margin — see our guide to Google Ads strategy for print-on-demand stores for how to structure campaigns around margin targets rather than ROAS alone.
Contribution margin vs gross margin vs net margin
These three get mixed up constantly. The difference is entirely about which costs each one subtracts.
- Gross margin subtracts only COGS. It answers "is this product worth making?"
- Contribution margin subtracts all variable costs. It answers "is this worth selling through this channel at this acquisition cost?"
- Net margin subtracts everything, including fixed costs. It answers "did the whole business make money?"
In the running example, a sixty percent gross margin becomes a forty percent contribution margin (CM2) and just fifteen percent after ads (CM3). Same order, three very different truths. Gross margin flatters you; contribution margin is the diagnostic; net margin is the final scoreboard.
As Wayflyer's 2026 guide explains, unlike gross margin, contribution margin "accounts for all variable costs, including fulfilment, transaction fees, and direct marketing spend" — making it a more complete measure of per-unit profitability for ecommerce and DTC businesses where ad spend is a significant variable cost. For a deeper look at where net margin benchmarks land for POD sellers, see our net profit margin benchmark.
SKU and channel-level contribution margin
Tracking contribution margin only at the store level hides which products and channels are actually driving profit. Saras Analytics notes that finance and marketing teams use contribution margin to evaluate profitability at the SKU, channel, and campaign level — and that many Shopify brands growing revenue find their profit shrinking because ROAS doesn't reveal this.
For POD sellers, practical SKU-level tracking means asking: does this design, on this product, sold through this ad campaign, clear a positive CM3? A $35 hoodie and a $22 tee can have identical ROAS but opposite contribution margins once you factor in different fulfillment costs and return rates. Running this analysis by product type also informs which SKUs to prioritize in paid campaigns — a direct input to increasing average order value and making each ad dollar work harder.
Why this is really a profit question
Contribution margin isn't trivia — it's the input to two decisions that determine whether you keep the lights on.
Break-even. Your break-even point in units is Fixed Costs ÷ Contribution Margin per unit. If your fixed costs run a set amount per month and each order contributes a CM3 dollar amount, that formula tells you exactly how many orders you need before hitting zero. According to Wayflyer, "once your total contribution margin exceeds your fixed costs, the business is profitable" — below that, you're losing money no matter how fast revenue grows.
Break-even on ads. The ROAS you need to break even is 1 ÷ contribution margin ratio. On a forty percent CM2 ratio, that's 1 ÷ 0.40 = 2.5 — you must earn at least $2.50 in revenue per ad dollar before advertising to avoid a loss. Run the same math on gross margin instead and you'd get a dangerously optimistic 1 ÷ 0.60 = 1.67, which is exactly how stores convince themselves a losing campaign is fine.
This is why contribution margin has to be built on true variable costs, not just COGS. Miss the shipping, fees, and fulfillment and your break-even, your target ROAS, and your pricing are all quietly wrong. The CRO techniques guide applies this same discipline to conversion rate — because raising your conversion rate on a negative-CM3 product just accelerates losses.
Getting this right per order is genuinely hard because the numbers live in different tools — product cost in Printify or Printful, ad spend in Meta or Google, fees on your payment statement. PodVector connects Shopify, Meta Ads, Google Ads, Printify, and Printful and reads live data into one warehouse, so the CM2 and CM3 you'd calculate by hand are already stitched together from real orders. Victor, PodVector's AI employee, analyzes that data and can act on it Shopify-side with your approval — repricing products to a target margin, adjusting discounts, or raising your free-shipping threshold. He reads your ad data and proposes moves, but does not touch your ad account. Start with PodVector free if you'd rather see the calculation than run it in a spreadsheet.
What is a good contribution margin for ecommerce?
Benchmarks vary significantly by category and business model. According to StoreHero's formula guide, fashion and apparel stores typically run contribution margins in the range of 50–70% at the CM1/gross level, while food and beverage runs lower. Wayflyer's 2026 ecommerce guide states that a healthy contribution margin after customer acquisition costs is a minimum of 20%, with sustainable brands targeting higher. For print-on-demand specifically — where fulfillment costs and per-item supplier fees are higher than self-warehoused goods — the practical test is whether your CM3 clears enough to cover fixed costs at a sales volume you can actually reach.
Compare notes across your fulfillment partners too. Our Printful vs Printify vs Teespring comparison breaks down how base costs differ, which directly affects the CM1 floor you're working from.
FAQs
What is the simplest way to calculate contribution margin?
Take the price of one unit and subtract every cost that scales with selling it — product, shipping, payment fees, and fulfillment. The number left over is your contribution margin. Divide it by the price for the ratio.
Do you include fixed costs in contribution margin?
No. Contribution margin deliberately excludes fixed costs like rent, salaries, and software. That's the entire point — it shows how much each sale contributes toward covering those fixed costs. Fixed costs come in later, at the net margin and break-even stage.
Is contribution margin the same as gross profit?
No, though they're close in some businesses. Gross profit subtracts only COGS; contribution margin subtracts all variable costs, including shipping, payment fees, and fulfillment. In the ecommerce example above, gross profit was $24 per order while contribution margin was $16 — the $8 gap is the variable costs gross profit ignores.
How do you find the contribution margin ratio?
Divide contribution margin by revenue and multiply by one hundred. In the worked example, $16 ÷ $40 × 100 = 40%. The ratio lets you compare products at different price points and feeds directly into break-even and target-ROAS math.
Should advertising count as a variable cost in contribution margin?
It depends on which tier you're calculating. Pre-ad contribution margin (CM2) leaves ad spend out; post-ad contribution margin (CM3) allocates it per order. CM3 is what tells you whether an order was profitable after acquisition cost, so for paid-heavy ecommerce it's usually the number that matters most.
What is a good contribution margin for a POD store?
It varies by product and channel mix. According to Wayflyer's 2026 guide, sustainable ecommerce brands target a minimum of 20% after customer acquisition costs. The practical test for POD: your CM3 ratio has to be high enough that total contribution covers your fixed costs at a sales volume you can actually reach. If break-even requires more orders than you can realistically sell, the margin is too thin — and repricing or renegotiating fulfillment costs is the lever to pull first. Use our Etsy-to-Shopify dropship guide to see how channel switching affects the cost structure underneath your contribution margin.