
What a gross margin calculator actually computes
A gross margin calculator answers a narrow question: after you pay for the physical product, what share of the sale price is left? That leftover share is your gross margin, and the dollars are your gross profit.
It does not tell you whether the sale made you money. Gross margin only subtracts one cost — the cost of goods sold (COGS). Every other cost of getting the order out the door still comes off after that.
So treat the calculator as a starting point, not a verdict. It is the right first tool for pricing a product, and the wrong tool for judging whether a campaign or a channel is profitable.
The gross margin formula
There are two numbers a gross margin calculator gives you, and they come from the same subtraction.
- Gross profit (dollars): Revenue − COGS.
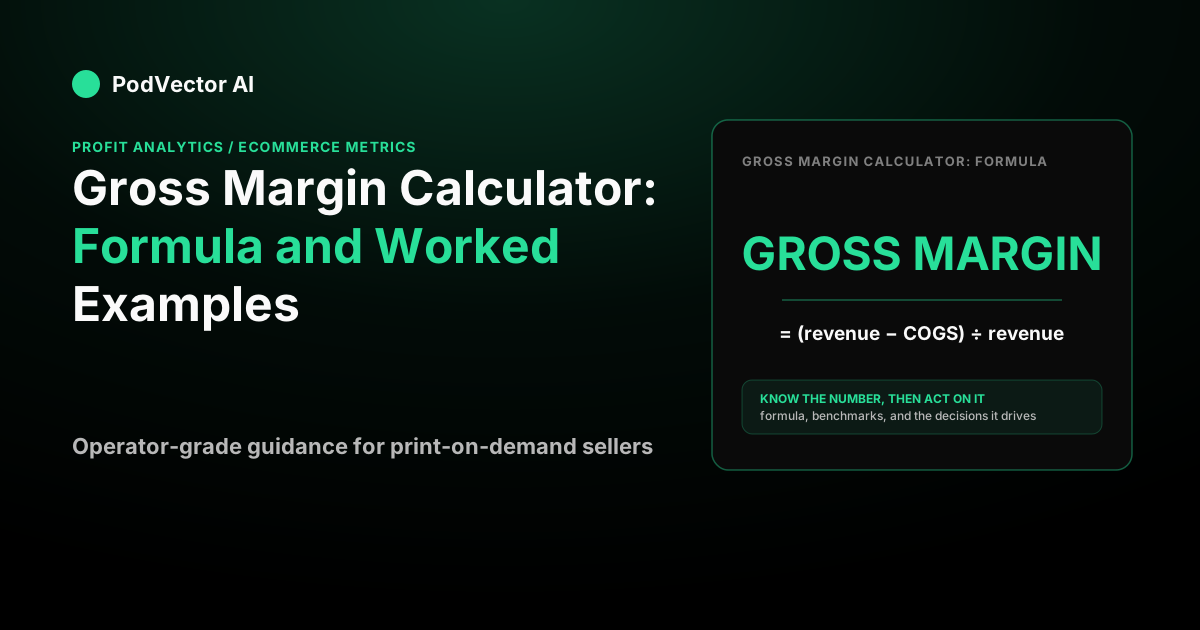
- Gross margin (percent): (Revenue − COGS) ÷ Revenue × 100.
COGS is the direct cost of the thing you sold. For a print-on-demand store that means the blank garment, the print charge, and any base fulfillment cost your supplier bakes into the item. It does not include the carrier shipping label, the Stripe fee, or your ad budget — those belong to later stages of the math.
The percent version is what you compare across products; the dollar version is what you actually bank per unit before other costs.
Worked example: a $40 print-on-demand order
Say you run an apparel store and your average order looks like this:
- Sale price (revenue): $40.00
- COGS (blank + print + supplier base fee): $16.00
Gross profit = $40.00 − $16.00 = $24.00. Gross margin = $24.00 ÷ $40.00 × 100 = 60%.
Sixty percent looks healthy. Hold onto it, because the rest of this guide shows how much of that 60% survives once real costs land. For a full map of how this metric connects to every other number in your store, the ecommerce metrics guide walks the whole chain end to end.
Gross margin vs markup: the mix-up that wrecks pricing
The single most common error a gross margin calculator prevents is confusing margin with markup. They describe the same dollar gap but from opposite ends.
- Markup measures the gap over your cost: (Price − Cost) ÷ Cost. On the shirt: $24 ÷ $16 = 150%.
- Margin measures the gap over your price: (Price − Cost) ÷ Price. On the shirt: $24 ÷ $40 = 60%.
Same $24. A 150% markup is a 60% margin. Suppliers and marketplaces quote markup; your profit-and-loss statement speaks in margin. If you set prices by "adding 60% markup" when you meant 60% margin, you will systematically underprice every product.
The conversion is worth memorizing: Margin = Markup ÷ (1 + Markup), and Markup = Margin ÷ (1 − Margin). Check it: 1.5 ÷ 2.5 = 0.60, and 0.60 ÷ 0.40 = 1.5. Both describe the same $16 cost and $40 price.
Gross margin vs net margin: what the calculator leaves out
Here is the profit angle almost every calculator page skips. Gross margin subtracts only COGS. Net margin subtracts everything — including shipping, fees, labor, ads, and fixed overhead like rent and software.
Watch the 60% erode as each real cost lands on that same $40 order:
- Gross profit (after COGS): $24.00 → 60%
- Minus carrier shipping ($5.00): $19.00
- Minus payment processing at 4% of $40 ($1.60): $17.40
- Minus pick-and-pack labor ($1.40): $16.00 → contribution margin before ads, 40%
- Minus allocated ad spend ($10.00): $6.00 → contribution margin after ads, 15%
Your "60% margin" product is really a 15% margin once ads are in. That is the number that decides whether scaling the order actually builds a bank balance. The metric that captures the pre-ad slice — 40% here — is the contribution margin ratio, and it is a far better guide to "should I sell more of this?" than gross margin alone.
For context on where the finish line sits, benchmark data compiled by Mercury from NYU Stern figures puts the apparel industry's average gross margin around the mid-fifties in percent and its net margin at only about three percent — proof of just how much disappears between the two lines.
From gross margin to per-order profit
The stage most sellers never calculate is the last one: profit per order after ads. In the example above it is $6.00 on a $40 sale.
That single number drives everything downstream. It sets your break-even volume, your maximum affordable acquisition cost, and whether a "good ROAS" is actually a good deal. Working out the ad-and-fulfillment cost behind each of those orders is exactly what a cost per order calculator is built to do — it picks up precisely where a gross margin calculator stops.
How to use gross margin to price and break even
Gross margin is most powerful as an input to two decisions.
Setting a price. Decide the margin you need, then solve for price: Price = Cost ÷ (1 − target margin). Want a 60% margin on a $16 cost? $16 ÷ 0.40 = $40. Want 65%? $16 ÷ 0.35 = $45.71. The calculator turns a margin goal into a price tag.
Finding your break-even ad efficiency. The break-even return on ad spend is simply 1 ÷ your margin ratio. On the honest 40% contribution margin, that is 1 ÷ 0.40 = 2.5 — every ad dollar must return $2.50 in revenue just to avoid a loss. On the flattering 60% gross margin it looks like only 1.67, which is exactly why using gross margin instead of contribution margin quietly convinces sellers that losing campaigns are winning ones.
Break-even in units follows the same logic: fixed costs ÷ contribution margin per order. If your fixed costs run $4,000 a month and each order clears $6 after ads, you need $4,000 ÷ $6 ≈ 667 orders just to reach zero. The break-even point formula covers this calculation in depth.
None of this works if orders never convert in the first place — margin math assumes traffic that buys, so if yours doesn't, start with why your conversion rate is low before blaming your pricing.
What a good gross margin looks like
There is no universal "good" gross margin — it depends entirely on how many costs you still have to cover after COGS. A store with heavy shipping and paid acquisition needs a much fatter gross margin than a business that sells digitally.
As a rough profitability yardstick at the bottom line, the guidance summarized by Omni Calculator treats a net margin in the low single digits as weak, around ten percent as okay, and roughly twenty percent as strong. Because so much erodes between gross and net, a healthy net margin usually demands a gross margin several times larger.
The practical test is not the percentage itself but whether the margin left after all variable costs still clears your acquisition cost with room to spare. Gross margin gets you to the starting line; contribution margin and per-order profit tell you if you can finish the race.
Stop guessing where your margin goes
A calculator gives you gross margin for one order at one moment. The harder question — what you truly keep across thousands of orders once real shipping, real fees, and real ad spend hit — needs live data, not a spreadsheet.
That is what PodVector is built for. It connects Shopify, Meta Ads, Google Ads, Printify, and Printful, then computes your true per-order profit — COGS, shipping, fees, and ad spend netted out automatically, so you see the $6, not just the $24. Victor, its AI employee, analyzes that data and proposes moves, executing approved actions on the Shopify side; he reads your ad data but does not touch your ad account. Victor is not a dashboard — he is an employee that works from the profit numbers your gross margin calculator can't reach.
See your true per-order profit with PodVector →
FAQs
What is the gross margin formula?
Gross margin is (revenue − cost of goods sold) ÷ revenue × 100. The dollar version, gross profit, is simply revenue minus COGS. For a $40 order with $16 of product cost, gross profit is $24 and gross margin is 60%.
What is the difference between gross margin and markup?
They measure the same dollar gap against different bases. Markup divides profit by cost; margin divides profit by price. A $16 product sold at $40 carries a 150% markup and a 60% margin. Confusing the two is the classic pricing error, because a "60% markup" price is far lower than a "60% margin" price.
Does gross margin include shipping and fees?
No. Gross margin subtracts only the direct cost of the product (COGS). Shipping, payment processing, pick-and-pack labor, and ad spend all come off afterward. Once they do, a 60% gross margin can fall to a 15% margin per order — which is why gross margin alone should never decide whether a channel is profitable.
What is a good gross margin for an ecommerce store?
It depends on your other costs. If you pay for shipping and paid ads, you need a high gross margin to survive the erosion down to net profit. As a bottom-line reference, Omni Calculator's guidance treats a low-single-digit net margin as weak and around twenty percent as strong, and reaching that usually requires a gross margin several times higher.
How do I turn a target gross margin into a price?
Divide your cost by one minus the target margin: Price = Cost ÷ (1 − margin). For a $16 cost at a 60% target margin, that is $16 ÷ 0.40 = $40. To hit 65%, you would price at $16 ÷ 0.35 = $45.71.
Why does my gross margin look healthy but my bank account doesn't?
Because gross margin stops at COGS. Every other variable cost — shipping, fees, fulfillment labor, and especially ad spend — lands after it. The gap between a 60% gross margin and a 15% post-ad margin is exactly the cash you were counting on but never kept. Tracking per-order profit instead of gross margin closes that blind spot.