
Most explanations of contribution margin per unit stop at "price minus variable cost" and hand you a two-line widget example. That's fine for an accounting exam and useless for running a store, because it ignores the costs that actually eat ecommerce margins: shipping, processing fees, pick-and-pack, and ad spend.
This guide walks a fully-costed example so you can see the real number, not the textbook one. If you want the wider map of how this metric connects to ROAS, LTV, and break-even, start with the ecommerce metrics guide.
What is contribution margin per unit?
Contribution margin per unit is the profit a single sale leaves behind after you subtract the variable costs tied to that sale. "Variable" means the cost only exists because the sale happened — no order, no cost.
It answers a sharper question than "are we profitable?" It answers: does selling one more of this, through this channel, at this price, make me money? That's why operators lean on unit contribution margin when deciding what to scale, what to discount, and what to kill.
The name is literal. Each unit's margin contributes to a shared pool. First that pool pays your fixed costs — rent, salaries, software. Once fixed costs are covered, every additional unit's contribution margin drops straight to profit.
Contribution margin per unit formula
The core contribution margin per unit formula is simple:
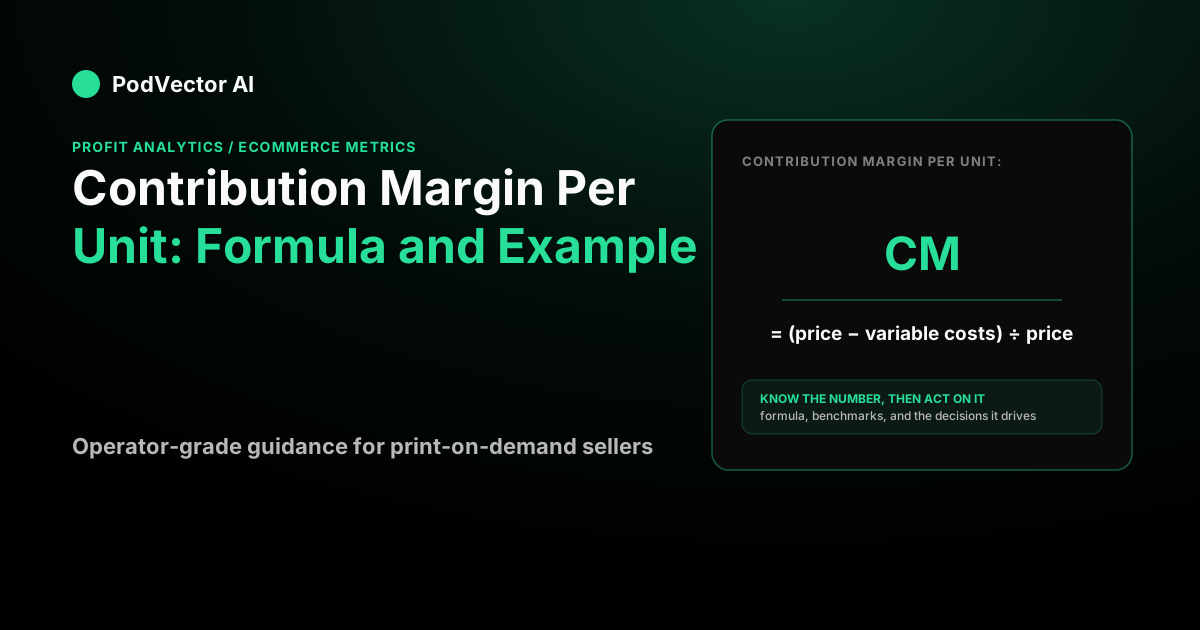
Contribution margin per unit = Selling price per unit − Variable cost per unit
To get the ratio (contribution margin as a percentage of price), divide by the price:
Contribution margin ratio = Contribution margin per unit ÷ Selling price × 100
The trap is not the formula — it's the "variable cost" term. Get the cost list wrong and every downstream decision inherits the error. For a physical or print-on-demand product, variable costs usually include:
- COGS — the product itself (for print-on-demand: the blank item plus the print/base fulfillment charge).
- Shipping — the carrier cost to get it to the customer.
- Payment processing — the percentage-plus-fixed fee your processor takes on each order.
- Fulfillment labor — pick, pack, and handling per order.
- Variable ad spend — optional, but if you allocate acquisition cost per order, it belongs here (this gives you a post-ad contribution margin).
Fixed costs — rent, salaries, your monthly SaaS stack — are deliberately excluded. They don't change when you sell one more unit, so they don't belong in a per-unit variable calculation. That exclusion is the whole point of the metric, and it's what separates it from gross margin.
A worked example: print-on-demand apparel
Say you run a print-on-demand apparel store and want the unit contribution margin on your best-selling tee. Here's one average order, costed line by line.
| Line | Amount | What it is |
|---|---|---|
| Selling price (example) | $40.00 | what the customer pays for the order |
| − Blank + printing (COGS) | −$16.00 | supplier's item and print charge |
| − Shipping | −$5.00 | carrier cost |
| − Payment processing | −$1.46 | processor fee on the order (below) |
| − Pick and pack labor | −$1.40 | handling per order |
| = Contribution margin per unit (before ads) | $16.14 | contributes to fixed costs + profit |
The processing line uses a real rate: the standard online card fee is 2.9% plus 30¢ per transaction, according to Stripe. On a $40 order that's (0.029 × $40) + $0.30 = $1.46. If you want to see how those fees stack up across your whole order volume, walk through how to calculate processing fees — they're small per order and large in aggregate.
So before advertising, each order contributes $16.14. The contribution margin ratio is $16.14 ÷ $40 = 40.4%.
Now allocate acquisition cost. Say your ads produce a return of four dollars of revenue per dollar spent, so you spend $10 to sell one $40 order. Subtract that:
Post-ad contribution margin per unit = $16.14 − $10.00 = $6.14 per order.
That's the number that tells the truth. This tee looks like a healthy 60% gross-margin product, but after the variable reality of shipping, fees, fulfillment, and acquisition, each sale actually keeps about six dollars. Everything above hangs on your ad efficiency — the same math is why blended ROAS matters so much for stores that live on paid traffic.
Contribution margin per unit vs. gross margin
These get confused constantly, and the difference decides whether you're reading a flattering number or an honest one.
Gross margin subtracts only COGS. In the example, gross margin is ($40 − $16) ÷ $40 = 60%. Gross margin tells you whether the product is worth making.
Contribution margin per unit subtracts every variable cost — COGS plus shipping, fees, fulfillment, and (optionally) ads. That 60% gross margin became a 40.4% contribution margin before ads, and a 15% ratio after ads. Contribution margin tells you whether the product is worth selling through this channel at this acquisition cost.
A store can post strong gross margins and still lose money on every order once you count the costs gross margin ignores. The per-unit contribution margin is where those hidden costs surface.
Why the per-unit view drives break-even
Contribution margin per unit is the engine of break-even analysis, because break-even is just "how many units of contribution do I need to cover my fixed costs?"
Break-even units = Fixed costs ÷ Contribution margin per unit
Say your fixed costs — software, a part-time helper, your storefront subscriptions — run $4,000 a month. Using the pre-ad contribution margin of $16.14:
$4,000 ÷ $16.14 = 248 orders per month to break even.
Use the post-ad contribution margin of $6.14 instead, and break-even jumps to $4,000 ÷ $6.14 = 652 orders. Same store, wildly different targets — which is exactly why you have to be honest about which variable costs you include. Anything above the break-even line converts contribution margin straight into profit; anything below means fixed costs are still eating your contribution pool.
This is also why small per-unit gains compound. Shaving your processing fee, trimming a dollar of fulfillment cost, or lifting your average order value all raise contribution margin per unit — and each dollar added lowers the break-even count and lifts profit on every unit above it.
Common mistakes that distort the number
Forgetting a variable cost. Leaving out shipping or processing inflates your contribution margin and your confidence. The example's margin drops from an imagined $24 (gross) to a real $16.14 once every variable line is counted.
Mixing in fixed costs. Allocating rent or salary "per unit" defeats the purpose — those don't scale with the next sale, and folding them in turns contribution margin into a muddier version of net margin.
Ignoring ad spend when you live on paid traffic. If ads drive the sale, acquisition is variable in every meaningful sense. A pre-ad contribution margin can look great while the post-ad number is near zero.
Reading margin without watching conversion. Your effective acquisition cost per order depends on how well traffic converts; a small lift there lowers cost per order and lifts post-ad contribution margin. A conversion rate calculator helps you see that lever.
Where PodVector fits
Costing one order by hand is easy. Doing it correctly for every order — as supplier prices, shipping, Stripe fees, and ad spend shift daily — is where most stores lose the thread.
PodVector connects Shopify, Meta Ads, Google Ads, Printify, and Printful, and computes true per-order profit from that live data — the same contribution-margin math above, run continuously instead of once in a spreadsheet. It's not a dashboard you have to interpret. Victor, its AI employee, analyzes your data and proposes moves; with your approval he executes Shopify-side actions. He reads your ad data to inform those moves but does not touch your ad account.
See your true per-order contribution margin with PodVector.
FAQs
What is contribution margin per unit in simple terms?
It's what one sale is worth after you subtract every cost that only exists because the sale happened. Price minus variable cost per unit. That leftover "contributes" to your fixed costs first, then to profit once fixed costs are covered.
What is the contribution margin per unit formula?
Contribution margin per unit = selling price per unit − variable cost per unit. For the ratio, divide the result by the price and multiply by 100. The formula is trivial; the accuracy lives entirely in listing your variable costs correctly.
Is unit contribution margin the same as gross margin?
No. Gross margin subtracts only COGS. Unit contribution margin subtracts all variable costs — COGS plus shipping, payment fees, fulfillment, and often ad spend. Gross margin is usually the flattering number; contribution margin is the honest one.
Should ad spend be included in contribution margin per unit?
If ads drive the sale, yes — it behaves like a variable cost. A common practice is to report two figures: a pre-ad contribution margin (product economics) and a post-ad contribution margin (channel economics). The post-ad number is the one that reflects whether scaling paid traffic actually pays.
How does contribution margin per unit relate to break-even?
Directly. Break-even units = fixed costs ÷ contribution margin per unit. A higher per-unit contribution margin means fewer units to cover your fixed costs, and every unit sold beyond that point turns its full contribution margin into profit.
What's a good contribution margin per unit?
There's no universal figure — it depends on your fixed-cost base and acquisition cost. The useful test is relative: your post-ad contribution margin per unit, multiplied by your realistic order volume, has to clear your monthly fixed costs with room to spare. Track the number over time and defend it as costs shift.