
What the CLV formula actually is
CLV (customer lifetime value) is the total value a single customer generates over the whole time they buy from you. It is the same metric as LTV — "LTV" tends to dominate in direct-to-consumer, "CLV" in finance and SaaS — so treat the two words as interchangeable.
The formula almost everyone teaches is the revenue version:
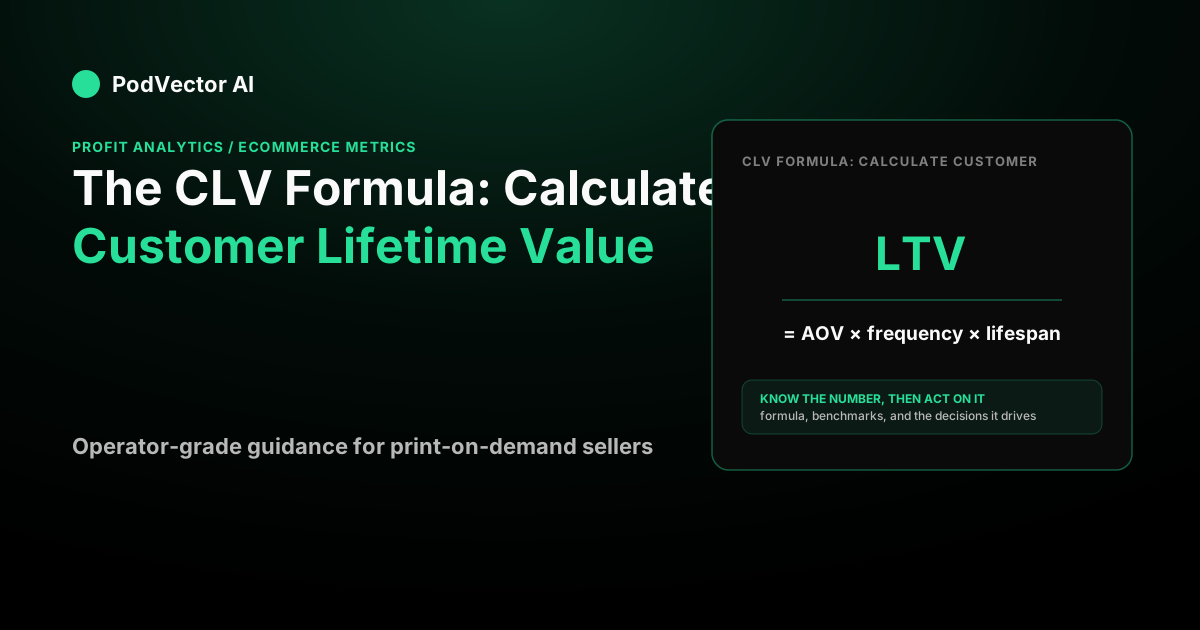
CLV = average order value × purchase frequency × customer lifespan
That is fine for a rough read, but it tells you what a customer spends, not what you keep. To make it useful, add one term — your gross-margin ratio:
CLV = average order value × purchase frequency × customer lifespan × gross-margin ratio
Now you have a profit figure you can compare directly against what it costs to acquire a customer. According to Omniconvert, this margin-adjusted version is the more accurate figure and the one that should govern real decisions. Everything below walks that formula through a real calculation.
There is also a discount-rate variant for more advanced modelling. According to Shopify, that version is: CLV = gross margin per customer lifespan × [retention rate ÷ (1 + discount rate − retention rate)]. It accounts for the time value of future cash flows and is worth using once your retention data is solid enough to trust a multi-year projection.
The four inputs, defined
Each input has an exact formula. Get these right and the rest is arithmetic.
Average order value (AOV)
AOV = total revenue ÷ number of orders. If a store did forty thousand dollars across a thousand orders, AOV is forty dollars. This is a per-order number, not per-customer — a customer who orders three times counts as three orders here. Raising AOV is one of the fastest CLV levers available; see our guide on increasing AOV with AI for tactics specific to print-on-demand stores.
Purchase frequency
Purchase frequency = number of orders ÷ number of unique customers, measured over a fixed window (usually a year), per Shopify. Two hundred repeat orders on top of eight hundred first orders across eight hundred customers gives 1.25 orders per customer per year. State the window every time, or the number is meaningless.
Customer lifespan
Lifespan is how long, in years, the average customer keeps buying. According to Shopify, this measures the length of time customers remain active before they stop making purchases. If you do not have years of history, derive it from churn: lifespan ≈ 1 ÷ churn rate. A store that loses half its customers each year has a lifespan of two years; one that loses a quarter has four. More on that shortcut below.
Gross-margin ratio
Gross margin = (revenue − cost of goods sold) ÷ revenue. This is the fraction of each dollar you keep after the product itself is paid for. It converts the whole formula from revenue to profit. According to GenerateKPI, the margin-adjusted CLV "is the number that should actually govern your acquisition budget — not top-line CLV." Our net profit margin benchmark guide gives context for where your margin should sit relative to other POD stores.
A worked example, start to finish
Say you run a print-on-demand apparel store. All the numbers below are an illustration, not market data — plug in your own.
Your average order value is forty dollars. Each average order costs sixteen dollars in blank garment, printing, and the supplier's base fulfillment charge — so cost of goods is forty percent of revenue and your gross margin is sixty percent. A typical customer places about 1.6 orders a year and stays with you for roughly two years.
Drop those into the profit-basis formula:
CLV = 40 × 1.6 × 2 × 0.60 = $76.80
That is the lifetime profit a customer represents. The revenue-basis version — leaving off the margin term — would read 40 × 1.6 × 2 = $128. Same customer, same behavior, two very different numbers. Always state which one you mean, because the gap between them is exactly the room where bad decisions hide.
Why the margin step matters more than anything
Here is the trap. Say your customer acquisition cost is about sixteen dollars per new customer (total sales and marketing spend divided by new customers). Compare it against the revenue-basis CLV of $128 and you get an LTV:CAC ratio of 8:1 — looks spectacular. Compare it against the profit-basis $76.80 and you get 4.8:1 — still healthy, but honest.
According to Shopify, a good LTV to CAC ratio is 3:1. According to Omniconvert, below 2:1 means acquisition is losing money, and above 5:1 suggests underinvestment in growth. If you measure that ratio on revenue-basis CLV, you will clear 3:1 long before you are actually profitable — and pour money into acquisition that never comes back.
This is also why CLV is an awareness-stage metric that quietly decides everything downstream: it sets the ceiling on what you can afford to pay for a customer, which sets your target cost per acquisition and your target return on ad spend. Understanding how attribution models in Google Ads interact with your reported ROAS matters here — a misattributed ROAS inflates the apparent CAC efficiency and skews your CLV:CAC read.
Deriving lifespan from churn when you lack history
Most stores under two years old cannot measure a real "lifespan," so they back into it from churn. The identity is simple: if a fixed share of customers stops buying each period, average lifespan is 1 ÷ churn rate.
Say forty percent of your customers churn each year. Lifespan ≈ 1 ÷ 0.40 = 2.5 years. If you cut that to thirty percent, lifespan stretches to 1 ÷ 0.30 ≈ 3.3 years — and because lifespan is a straight multiplier in the CLV formula, your customer lifetime value climbs by the same third without spending an extra cent on ads. Retention is the cheapest lever on CLV there is.
Anchor your churn assumption to reality before you trust it. According to Opensend, non-subscription ecommerce is brutal on retention: the average non-subscription store loses roughly seventy-seven percent of its customers in a year. If your own numbers are wildly better than those benchmarks, double-check the math before you build a budget on it.
The payoff for improving retention is outsized. HubSpot cites the classic Bain research finding that a five-percent increase in retention can lift profit by more than twenty-five percent. That leverage is why CLV and churn belong on the same scorecard.
How to segment CLV by customer type
A single store-wide CLV average can hide a bimodal reality: a large crowd of one-order buyers pulling the average down, and a small group of repeat buyers pulling it up. Treating them identically wastes budget on the wrong group.
According to Omniconvert, the recommended approach is to use RFM scoring — recency, frequency, monetary value — to split your base into tiers, then compute a CLV for each tier. That gives you three actionable numbers: the value of your best customers (defend and replicate them), your mid-tier customers (nudge toward the next purchase), and your one-time buyers (decide whether a win-back campaign pays). Knowing your average checkout completion rate by segment adds another layer — a high-CLV segment with a low checkout rate is money left on the table at the very last step.
According to Salesforce, thinking about CLV this way helps "prioritize which relationships are truly worth the investment" — and for a POD store, that often means shifting ad spend toward cohorts with proven repeat behavior rather than always hunting cold traffic.
Predictive CLV vs. historical CLV
The formula above produces historical CLV — it tells you what happened. As InfluenceFlow notes, predicting future value is "where real power emerges." Predictive CLV uses your existing cohort data to forecast what a newly acquired customer is likely to be worth, allowing you to set acquisition bids before you have years of purchase history.
For most POD sellers, a simple cohort approach works well: group customers by the month they first bought, track their cumulative revenue over three, six, and twelve months, and project forward. When that cohort curve flattens early, churn is high; when it keeps climbing at month six, you likely have a product or audience that generates genuine repeat buyers worth paying more to acquire.
This connects directly to ad channel decisions. Our comparison of Facebook vs Google Ads for POD sellers covers how the repeat-purchase dynamics differ by channel — Meta tends to produce higher-frequency buyers in apparel niches, which meaningfully shifts the CLV math.
Common CLV formula mistakes
Mixing revenue and profit across a ratio. If your CLV is revenue-basis but your CAC is a real cash cost, the ratio is apples-to-oranges and overstates your health by the size of your margin. Keep both numerators on the same basis.
Ignoring returns and refunds. A refund booked next month quietly lowers real AOV and margin. CLV built on gross day-one revenue overstates the truth.
Using a blended average over a bimodal base. One "$76.80 CLV" can hide a crowd of one-order buyers plus a few whales. Segment before you act on it — recency-frequency-monetary scoring is the usual tool.
Forgetting that AOV, frequency, and margin all move. CLV is a snapshot of current behavior, not a promise. Recompute it every quarter.
Ignoring fulfillment cost accuracy. For POD stores specifically, the cost-of-goods figure flowing into your gross margin depends entirely on how accurately your Printify or Printful costs are captured at the order level. A margin figure built on incomplete cost data produces a CLV that is optimistic by exactly the error in your cost data — which is why reconciled, order-level cost data matters so much. Our breakdown of the Printify free plan's costs and charges is useful context if you are not yet sure what costs Printify actually passes through.
Once you know your CLV and your per-customer cost, the natural next question is how many orders you need before the whole store is in the black. Our CRO techniques guide covers the conversion-rate side of that equation — because a higher conversion rate means a lower effective CAC, which improves your CLV:CAC ratio without touching the CLV side at all.
Where the numbers come from — and why they lie
The CLV formula is one line of arithmetic. The hard part is trusting the inputs, and that is where most stores quietly go wrong. Your AOV lives in Shopify, your ad-driven acquisition cost lives in Meta and Google, your product cost lives in Printify or Printful, and your fees live in Stripe. Stitch them together by hand and every number drifts.
PodVector connects Shopify, Meta Ads, Google Ads, Printify, and Printful into a live data warehouse and computes your true per-order profit — the exact margin figure the CLV formula depends on. Victor, its AI employee, reads that live data and proposes moves; with your approval, he acts on the Shopify side of your store. He reads your ad data but does not touch your ad accounts. It is not a dashboard you have to interpret; it is an employee working from numbers that already reconcile.
See your true per-order profit with PodVector
FAQs
What is the simplest CLV formula?
CLV = average order value × purchase frequency × customer lifespan. That gives you lifetime revenue per customer. Multiply by your gross-margin ratio to convert it to lifetime profit, which is the version you should actually make decisions from.
What is the difference between CLV and LTV?
None — they are two names for the same metric, customer lifetime value. "LTV" is more common in direct-to-consumer and startups; "CLV" shows up more in finance and SaaS. Just make sure that whichever term you use, you know whether the number is on a revenue or profit basis.
Should CLV be based on revenue or profit?
Profit, for almost every real use. A revenue-basis CLV overstates a customer's worth by the size of your margin, so any ratio you build on it — especially against acquisition cost — will look healthier than reality. According to Omniconvert, a healthy CLV:CAC ratio is 3:1, and below 2:1 means acquisition is losing money. Use the gross-margin-adjusted version so the ratio reflects cash reality.
What is the discount-rate CLV formula?
According to Shopify, the discount-rate version is: CLV = gross margin per customer lifespan × [retention rate ÷ (1 + discount rate − retention rate)]. It adjusts for the time value of money, making it more accurate for long-horizon projections. For most POD sellers who are still building their retention baseline, the simpler four-factor formula is the right starting point.
How do I find customer lifespan if my store is new?
Derive it from churn: lifespan ≈ 1 ÷ churn rate. If you lose forty percent of customers a year, lifespan is about 2.5 years. Anchor your churn estimate to a benchmark first — according to Opensend, non-subscription ecommerce averages roughly seventy-seven percent annual churn — so a very low churn assumption deserves a second look before you build a budget on it.
What is a good LTV:CAC ratio?
According to Shopify, a good LTV to CAC ratio is 3:1. According to Omniconvert, below 2:1 means acquisition is losing money and above 5:1 suggests you could safely invest more in growth. Measure the LTV side on profit, not revenue, or the ratio flatters you.
How often should I recalculate CLV?
At least quarterly. AOV, purchase frequency, margin, and churn all move as your pricing, product mix, and retention change, and CLV is only ever a snapshot of current behavior — not a fixed property of a customer.
What is RFM and how does it relate to CLV?
RFM stands for recency, frequency, and monetary value — a scoring method that ranks customers on how recently they bought, how often they buy, and how much they spend. According to Omniconvert, RFM segmentation is the standard tool for breaking a single blended CLV into tier-level CLVs you can actually act on. High-RFM customers typically have a CLV several multiples above the store average and are the segment most worth protecting with retention tactics.