
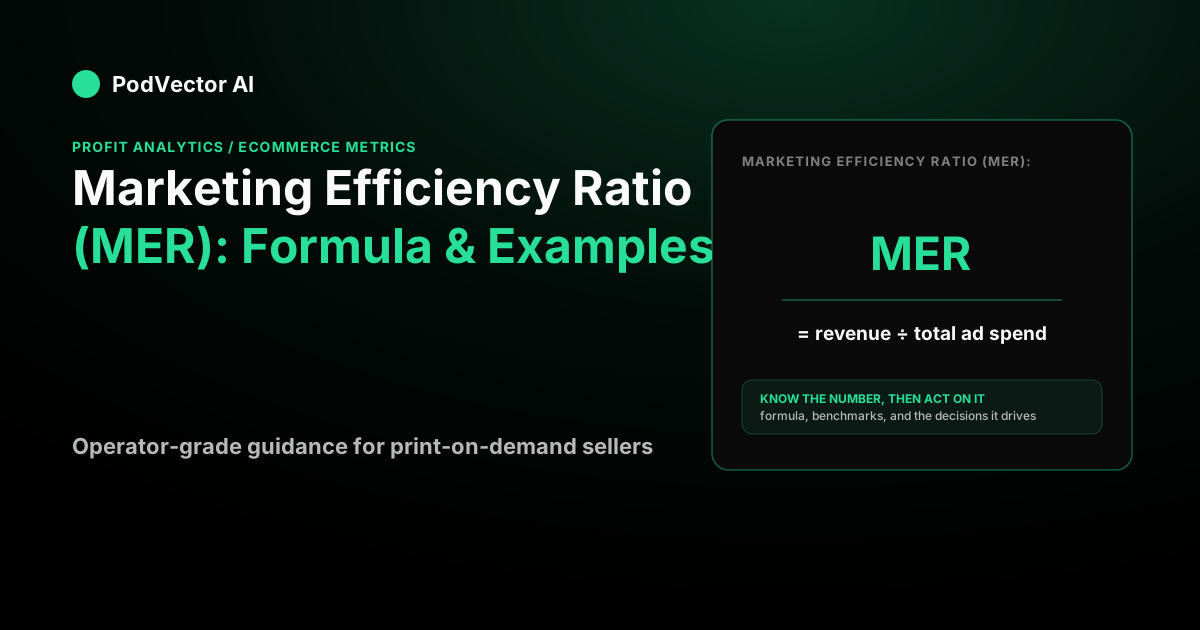
The marketing efficiency ratio (MER) is total revenue divided by total marketing spend — a store-wide read of how much revenue every marketing dollar produces. The marketing efficiency ratio formula is MER = Total revenue ÷ Total marketing spend. If you generate forty thousand dollars in revenue on twelve thousand five hundred dollars of total marketing, your MER is 3.2, meaning you earn three dollars and twenty cents for every dollar spent.
Unlike ROAS, which grades one channel using that platform's own attribution, MER judges the whole marketing engine at once and can't double-count. It is a starting point for profitability, not a profit number by itself.
What is the marketing efficiency ratio?
The marketing efficiency ratio definition is simple: it is the ratio between all the revenue your business earns and everything you spend to market it. You will also see it called media efficiency ratio, blended ROAS, or eROAS.
The reason MER exists comes down to trust. Every ad platform grades its own homework — Meta claims credit for a sale, Google claims the same sale, and if you add their reported numbers you count that order twice. MER sidesteps the whole mess by ignoring channel attribution and looking only at totals your bank account can confirm.
That makes MER the honest scoreboard for whether your marketing, taken as a whole, is pulling its weight. It sits at the top of the funnel of metrics you should track alongside the rest of your ecommerce metrics.
Marketing efficiency ratio formula
The marketing efficiency ratio formula has one shape:
MER = Total revenue ÷ Total marketing spend
The result is a ratio, usually written as a number like 3.2 or as a percentage (320%). A higher number means more revenue per marketing dollar.
Two decisions drive every marketing efficiency ratio calculation, and getting them wrong is where most people go astray:
- What counts as revenue? Use total store revenue for the same period, across every channel — paid, organic, email, and direct. MER is deliberately blended.
- What counts as marketing spend? This is broader than ad spend. Include ad platform costs plus agency retainers, freelancer fees, software subscriptions, and email tools. If it exists to drive demand, it belongs in the denominator.
Skip the second point and you have merely recomputed blended ROAS. MER's denominator is wider on purpose — it captures the tools and people behind the ads, not just the media buy.
Marketing efficiency ratio calculation: a worked example
Say you run a print-on-demand apparel store we'll call Summit POD. Here is one month of totals.
- Total revenue: $40,000
- Ad spend (Meta + Google): $10,000
- Non-ad marketing (email platform, tools, a freelancer): $2,500
- Total marketing spend: $12,500
Run the marketing efficiency ratio calculation:
MER = $40,000 ÷ $12,500 = 3.2
So Summit earns $3.20 in revenue for every $1.00 of total marketing spend. Notice this is lower than the store's blended ROAS of $40,000 ÷ $10,000 = 4.0. That gap is not an error — it is the $2,500 of non-ad marketing that ROAS quietly ignores and MER honestly includes.
That relationship always holds: because total marketing spend is at least as large as ad spend, MER is always less than or equal to blended ROAS. The ratio between the two (here 4.0 ÷ 3.2 = 1.25) is exactly how much your total marketing exceeds your raw ad spend.
MER vs ROAS: which should you use?
MER and ROAS answer different questions, so you need both.
ROAS (return on ad spend) is revenue divided by ad spend for a single campaign or channel. It is the right tool for optimizing — deciding which ad set to scale and which to cut. But it depends entirely on the platform's attribution, and platforms are generous graders.
The mer marketing efficiency ratio is store-wide and attribution-free. It is the right tool for judging — answering "is the whole marketing engine profitable?" without any single platform's self-interest baked in.
The gap between them is often revealing. Northbeam describes a DTC brand that saw a 2.0 ROAS in Meta but a 3.5 MER across all channels once halo effects on organic and email were counted. If you want to set channel-level targets that ladder up to a healthy blended number, our target ROAS calculator walks through the math.
A quick way to remember it: ROAS optimizes a channel, MER grades the business.
What is a good marketing efficiency ratio?
There is no universal answer, because the right MER depends entirely on your margins. But the common benchmarks give you a starting frame.
Shopify puts a healthy range for established brands at between 3 and 5, or 300% to 500%. Growth-stage brands intentionally running MER lower to buy market share are a normal exception, not a failure.
Here is the trap, though: MER alone cannot tell you if you are profitable. A 3.2 MER is excellent on a 60% gross margin and a disaster on a thin one. The number that matters is where your MER sits relative to your break-even.
Your break-even MER is 1 ÷ your contribution-margin ratio. If your margin after product cost, shipping, and fees is 40%, you break even at 1 ÷ 0.40 = 2.5. Summit's 3.2 clears that comfortably. This is the same identity that governs break-even ROAS, so the margin you plug in must be defined consistently across both — and it's why understanding your true markup and margin is a prerequisite, not an afterthought.
How to improve your marketing efficiency ratio
Because MER is revenue over spend, you improve it by lifting the numerator or trimming the denominator without hurting the other. The highest-leverage moves:
- Raise average order value. Bundles and upsells lift revenue per order without adding a cent of marketing spend, so they flow straight into MER.
- Convert more of the traffic you already pay for. A higher conversion rate means the same ad spend yields more orders. Recovering lost checkouts is one of the biggest opportunities here — Baymard's long-run research puts the average documented cart abandonment rate near 70%, and you can dig into the leak in our cart abandonment rate guide.
- Cut wasted media cost. Rising ad prices quietly erode MER. Watch your delivery costs — our CPM guide covers what you pay to reach a thousand people and how to keep it in check.
- Prune non-ad marketing. Overlapping tools and idle retainers sit in MER's denominator. Trimming them lifts the ratio directly.
MER is a starting line, not the finish
Here is the honest limitation every guide should state: MER is a revenue ratio, and revenue is not profit. A great MER on a thin margin still loses money once product cost, shipping, and fees are netted out.
The number that actually pays your rent is profit on ad spend, which equals ROAS × your margin ratio. On Summit's 60% gross margin, a 4.0 ROAS becomes 4.0 × 0.60 = 2.4 — every ad dollar returns $2.40 in gross profit. MER points you in the right direction; per-order profit tells you whether you actually arrived.
That is the layer most stores are missing, because stitching the numbers together by hand across platforms is brutal. PodVector connects your Shopify, Meta Ads, Google Ads, Printify, and Printful accounts and computes true per-order profit — the real cost of each sale, not a blended average. Victor, its AI employee, reads that live data and proposes moves, taking approved actions on the Shopify side; he does not touch your ad account. It is not a dashboard you have to interpret — it does the profit math for you so MER stops being a guess.
FAQs
What is the marketing efficiency ratio formula?
The marketing efficiency ratio formula is total revenue divided by total marketing spend for the same period. Revenue is your whole store's sales across every channel; marketing spend is all demand-generation cost, including ad platforms plus tools, agencies, and freelancers. The output is a ratio like 3.2 or a percentage like 320%.
Is MER the same as blended ROAS?
They are close but not identical. Both ignore channel attribution and use total revenue. The difference is the denominator: blended ROAS divides by ad spend only, while the mer marketing efficiency ratio divides by all marketing spend. Because MER's denominator is broader, MER is always less than or equal to blended ROAS.
What is a good marketing efficiency ratio?
Shopify cites a healthy range of 3 to 5 for established brands, but the only benchmark that matters for you is your break-even MER, which equals one divided by your contribution-margin ratio. A 40% margin means you break even at 2.5, so anything above that is profitable territory. Growth-stage brands sometimes run lower on purpose to acquire customers faster.
Why is my MER lower than my ROAS?
Because MER counts more spend. ROAS divides revenue by ad spend alone, while the marketing efficiency ratio divides the same revenue by total marketing spend — ads plus tools, software, and people. That larger denominator always produces a smaller or equal number. The gap between them equals how much your total marketing exceeds raw ad spend.
Can MER tell me if I'm profitable?
Not on its own. MER is a revenue ratio, so it says nothing about margin. A strong MER on a thin-margin product can still lose money after product cost, shipping, and fees. To judge profitability, compare your MER to your break-even MER, or move to a profit-based metric like profit on ad spend, which multiplies ROAS by your margin ratio.