
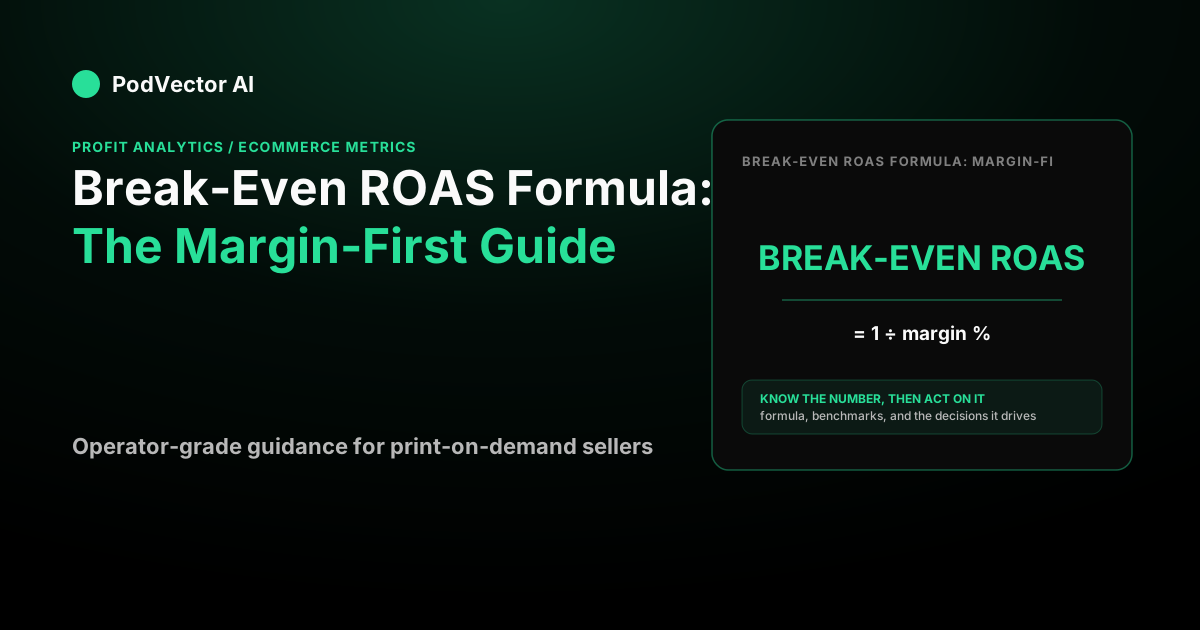
The break-even ROAS formula is 1 ÷ your contribution-margin ratio. That is the return on ad spend at which ad-driven revenue exactly covers your product cost, shipping, fees, and the ad spend itself — leaving zero profit and zero loss.
If your contribution margin after all variable costs is 40% of revenue, your break-even ROAS is 1 ÷ 0.40 = 2.5. Anything above 2.5 makes money; anything below loses it. Use contribution margin, not gross margin, or the number will lie to you.
What break-even ROAS actually means
Break-even ROAS is the return on ad spend where your ads stop losing money and start making it — no profit, no loss. Above it you are profitable; below it every sale digs the hole deeper, no matter how busy the campaign looks.
Most sellers watch reported ROAS in the ad platform and guess whether it is "good." Break-even ROAS replaces the guess with a line in the sand. It answers one question: what is the lowest ROAS I can run this campaign at and not go backwards?
As GentoolLab puts it, break-even ROAS (also written BEROAS) is "the specific ROAS at which your ad revenue exactly covers your variable costs — leaving zero profit, but also zero loss." Get that line right and every campaign decision — scale, pause, or fix — becomes arithmetic instead of a hunch.
According to Pro Marketer, many ecommerce brands celebrate a 2× or 3× ROAS without realising their margin structure requires more. Break-even ROAS gives you the clear baseline: everything above it is profit, everything below it is loss.
The break-even ROAS formula
The formula is short. The discipline is in which margin you feed it.
Break-even ROAS = 1 ÷ contribution-margin ratio
Your contribution-margin ratio is the share of each order's revenue left after every variable cost except ad spend. The identity works because, at break-even, the margin dollars thrown off by ad-driven revenue exactly equal the ad spend. If margin ratio is m and revenue is R on spend S, break-even means m × R = S. Divide both sides by S and R ÷ S is just ROAS, so m × ROAS = 1, which rearranges to ROAS = 1 ÷ m.
There is an equivalent AOV-based form that some sellers find easier, noted by GentoolLab: Break-even ROAS = AOV ÷ (AOV − Variable Costs Per Order), where variable costs per order include COGS, shipping, transaction fees, and a returns allowance. Both roads lead to the same place. The 1 ÷ margin form is cleaner because it forces you to state your margin out loud.
The whole game is the denominator. Pick the wrong margin and you will confidently scale a campaign straight into a loss.
Gross margin vs contribution margin: the trap
The break-even ROAS formula you will see quoted most often uses gross margin — revenue minus cost of goods sold. That is the optimistic number, and it is where sellers get burned.
Gross margin ignores shipping, payment processing, and pick-and-pack labor. Those are real dollars that leave your account on every single order. A break-even ROAS built on gross margin tells you that you are safe well before you actually are.
As adLibrary notes, "a 30% margin product needs at least 3.3× ROAS to break even" — and that floor rises further once you factor in shipping and fees that gross margin ignores. A fashion or apparel brand with a thin gross margin can require a ROAS that most Meta campaigns cannot sustain consistently, per HQ Digital.
Contribution margin fixes this. It subtracts all variable costs — product, shipping, fees, fulfillment labor — leaving the true dollars each order contributes before you spend a cent on ads. That is the honest denominator for the break-even ROAS formula. The gap between the two matters: gross margin says whether a product is worth making, while contribution margin says whether it is worth selling through paid ads at your current cost to acquire a customer.
Here is the rule of thumb. Compute break-even ROAS on gross margin and you will get a low, comfortable number. Compute it on contribution margin and you will get the number that keeps you solvent. Always use the second one.
A full worked example: a Shopify print-on-demand store
Say you run a print-on-demand apparel store on Shopify. The numbers below are an example so you can swap in your own — walk the arithmetic, not the figures.
Say your average order is $40. Your costs on that order:
- Product cost (blank garment plus print): $16
- Shipping (carrier): $5
- Payment processing at 4% of $40: $1.60
- Pick-and-pack labor: $1.40
Start with gross margin. Revenue minus product cost only: $40 − $16 = $24, which is $24 ÷ $40 = 60% gross margin. Plug that into the formula and you get a break-even ROAS of 1 ÷ 0.60 = 1.67. That is the number that looks great and lies.
Now do it honestly with contribution margin. Subtract every variable cost except ads: $40 − $16 − $5 − $1.60 − $1.40 = $16 per order, which is $16 ÷ $40 = 40% contribution margin. The real break-even ROAS is 1 ÷ 0.40 = 2.5.
Look at the gap. The gross-margin version says you break even at 1.67, so a campaign running at a 2.0 ROAS looks profitable. The contribution-margin version says you actually need 2.5 to break even — so that same 2.0 campaign is quietly losing money on every order. That single mistake, repeated across a scaled ad account, is how stores post record revenue and shrinking bank balances.
The break-even ROAS formula ecommerce operators trust is the contribution-margin one. It is the only version that survives contact with a real fulfillment bill.
Including returns in your break-even ROAS
Returns are a subtopic that current top results now explicitly flag, and for good reason. HQ Digital notes that many marketers "are running campaigns that are below break-even ROAS — they just don't know it because they're calculating ROAS on gross revenue instead of net revenue after returns and discounts." A meaningful return rate compresses your effective revenue per order, which pushes your true break-even ROAS higher than the formula suggests on gross figures.
The fix is simple: build a returns allowance directly into your variable cost stack before computing contribution margin. GentoolLab lists a returns allowance alongside COGS, shipping, and transaction fees as a standard line in the variable cost per order. If returns run at, say, 10% of orders on your POD store, add the expected net reverse-logistics cost to each order's cost column and recompute. The break-even ROAS output will be more conservative — and more accurate.
Blended ROAS vs channel ROAS: which to compare to break-even
Ad platforms report channel-level ROAS. Your break-even number is a business-level floor. Comparing the two directly can mislead you.
As adLibrary explains, "if blended ROAS is healthy while channel ROAS looks weak, the attribution gap is the problem — not the campaign." Channel ROAS is subject to over-attribution (especially on Meta post-iOS changes), double-counting across platforms, and last-click distortion. Blended ROAS — total revenue divided by total ad spend across all channels — is harder to game and closer to the truth your break-even formula actually needs.
For POD sellers running Meta and Google simultaneously, the safest habit is to compute break-even ROAS at the account level, then check blended performance against it. Per-channel numbers are useful for creative and audience decisions; blended numbers are what you compare to your break-even floor.
From break-even to target ROAS
Break-even keeps you from losing money. It does not make you any. For that you need a target ROAS: break-even plus a profit buffer.
As Pro Marketer frames it: "break-even ROAS is the minimum you need to avoid losing money. Target ROAS is the performance level you aim for to generate meaningful profit and fund growth. Your target should always sit comfortably above your break-even threshold."
On a 40% contribution-margin base, say you want to keep 15% of revenue as profit after ads (a CM3 margin, in the jargon). You need roughly 1 ÷ (0.40 − 0.15) = 4.0. So a target ROAS of 4.0 leaves you a healthy cushion, while 2.5 is the floor you must never fall below.
The two numbers do different jobs. Break-even ROAS is the tripwire for pausing or fixing a campaign. Target ROAS is the goal you optimize toward. Knowing both turns "is this ad working?" into a decision with two clean thresholds instead of a vibe.
It is worth checking your target against the whole business, not just one campaign, because ad platforms over-credit themselves. A store-wide read like marketing efficiency ratio (MER) — total revenue over total marketing spend — catches the profit that per-channel ROAS misses, and it can't double-count conversions the way stacked platform reports do. See our guide on net profit margin benchmarks for the broader profitability context.
Where sellers get the break-even ROAS formula wrong
Even with the right formula, a few habits quietly break the math.
Using gross margin out of habit. Covered above, and worth repeating because it is the number-one error. Shipping and fees are not rounding. HQ Digital observes that break-even ROAS "is the floor" — not the target — and treating a gross-margin-derived floor as a contribution-margin floor is a silent profit killer.
Ignoring returns and refunds. A campaign that looks profitable on day-one revenue can flip negative once returns settle. Net them out of revenue before computing margin, or your break-even ROAS will be too low.
Forgetting that returning customers inflate ROAS. Ads often get credit for repeat buyers who would have purchased anyway, which flatters your ROAS and hides weak acquisition. Splitting out new-customer ROAS reveals whether acquisition actually pays. Improving your checkout completion rate is one lever that improves effective new-customer ROAS without touching ad spend at all.
Confusing margin with markup. A $16 cost and a $40 price is a 150% markup but a 60% margin — same gap, two different numbers. The formula wants margin (over price), not markup (over cost). Mixing them up throws the whole calculation off.
Using platform ROAS as the check number. As adLibrary notes, last-click attribution is systematically distorted post-iOS, meaning the ROAS figure in your Meta or Google dashboard is likely over-stated. Compare your break-even threshold to blended ROAS, not platform ROAS, to get an honest read.
Skipping CRO when ROAS slips. When a campaign drifts below break-even, the reflex is to cut spend or raise bids. But the fix is sometimes on the landing page: a higher conversion rate means more revenue on the same spend, which lifts ROAS without touching the ad. Our CRO techniques guide covers the highest-impact on-site levers for POD sellers.
How AOV affects your break-even ROAS
Average order value is the quietest lever in the break-even equation. Higher AOV means fixed-per-order costs (shipping, processing) represent a smaller share of revenue, which widens your contribution margin and lowers your break-even ROAS threshold. A store that raises AOV from $40 to $55 on the same product cost structure can move its break-even ROAS from 2.5 down toward 2.0 — giving the ad account substantially more room before campaigns go underwater.
Tactics like bundles, upsells, and raised free-shipping thresholds all compound here. See our guide on increasing AOV with AI for a practical POD playbook.
Where PodVector fits
The break-even ROAS formula is only as good as the cost numbers you feed it — and those numbers are scattered across your storefront, ad accounts, supplier, and processor.
PodVector connects Shopify, Meta Ads, Google Ads, Printify, and Printful, then computes true per-order profit — product cost, shipping, fees, and ad spend netted out for every order. That gives you a real contribution margin to plug into the formula instead of a guess. Victor, PodVector's AI employee, analyzes that live data and proposes moves, taking Shopify-side actions only with your approval. He reads your ad data to flag where you are running under break-even, but he does not touch your ad account. PodVector is not a dashboard; it is the profit math underneath your decisions.
If you are on Printful, see our honest Printful review for a breakdown of the cost structure Victor reads to anchor your margin calculations.
See your true per-order profit with PodVector →
FAQs
What is the break-even ROAS formula?
Break-even ROAS = 1 ÷ contribution-margin ratio. If your contribution margin is 40% of revenue, your break-even ROAS is 1 ÷ 0.40 = 2.5. Above that you profit; below it you lose money. An equivalent form noted by GentoolLab is AOV ÷ (AOV − Variable Costs Per Order) — both expressions yield the same result.
Should I use gross margin or contribution margin in the formula?
Contribution margin, almost always. Gross margin only subtracts product cost and ignores shipping, payment fees, and fulfillment labor, so it produces a break-even ROAS that is too low and makes losing campaigns look profitable. Contribution margin subtracts every variable cost and gives you the honest number.
What is a good ROAS above break-even?
There is no universal figure — it depends on your margin and profit goal. As Pro Marketer frames it, your target should always sit comfortably above your break-even threshold. If you break even at 2.5 and want to keep 15% of revenue as profit, aim for roughly 4.0. Break-even is your floor; the target is your goal.
How does break-even ROAS relate to CAC and LTV?
Break-even ROAS assumes you profit on the first order. If repeat purchases are strong, you can afford a lower break-even because lifetime value covers acquisition over time. The more repeat revenue a customer brings, the more aggressive your acquisition can be — which is why improving retention changes the entire margin calculus that justifies your break-even floor.
Why does my real ROAS look fine but my bank account doesn't?
Usually one of three leaks: you are computing break-even on gross margin instead of contribution margin, returns are eating into revenue after the sale, or your platform ROAS is over-stated because of attribution gaps. As adLibrary notes, "the attribution gap is the problem" when blended and channel ROAS diverge. Rebuild your break-even ROAS on true per-order contribution margin and check it against blended ROAS — the gap usually explains itself. For a broader look at profitability inputs, see our net profit margin benchmark reference.
How does AOV affect break-even ROAS?
Higher AOV spreads fixed-per-order costs across more revenue, widening your contribution margin and lowering your break-even ROAS. That gives your ad account more headroom before campaigns go unprofitable. Raising your free-shipping threshold or adding bundles are two of the fastest AOV levers for POD sellers — see our AOV guide for step-by-step tactics.
What is blended ROAS and should I compare it to my break-even?
Blended ROAS is total revenue divided by total ad spend across all channels. It is less susceptible to attribution distortion than single-channel platform ROAS, making it the more reliable number to compare against your break-even threshold. Use per-channel ROAS for creative and audience decisions; use blended ROAS to judge whether the overall account is above or below your break-even floor.