
Most "how to improve gross profit" guides give you the same four verbs: raise prices, cut costs, upsell, get efficient. They rarely show the math, so you can't tell which lever is worth your time this month. This guide walks the actual numbers on a print-on-demand (POD) store, then shows the gap between gross profit and the profit that actually lands in your bank account.
Gross profit, defined once
Gross profit is revenue minus the cost of goods sold (COGS) — the direct cost of the products you sold. Gross margin is that same figure as a percentage of revenue.
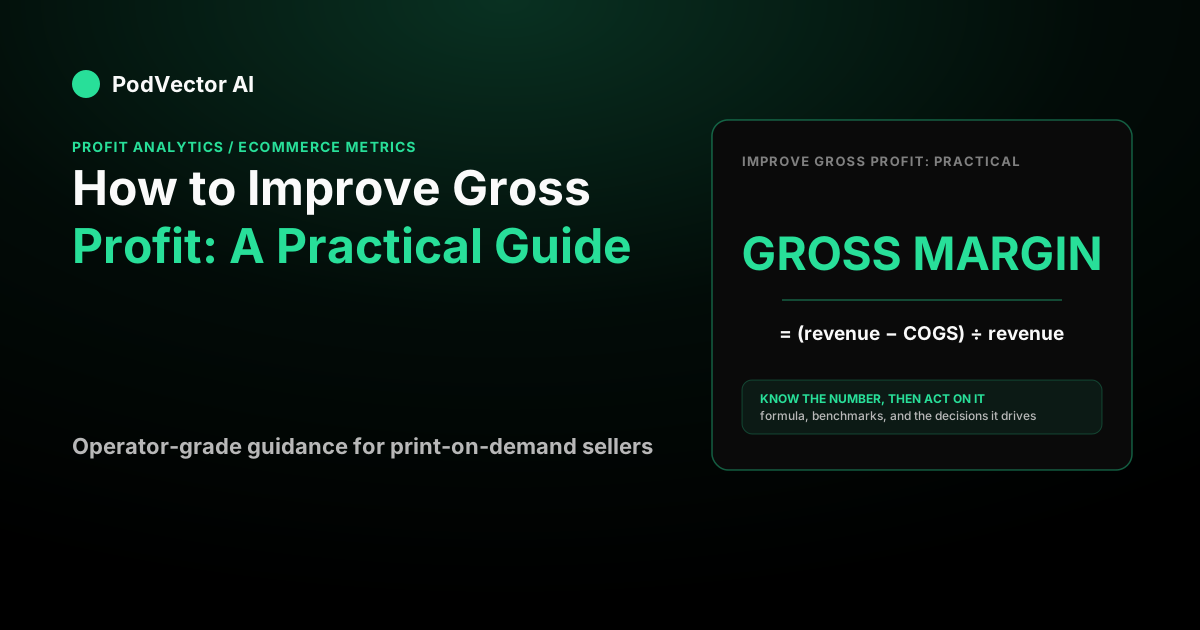
The formula is simple: Gross margin % = (Revenue − COGS) ÷ Revenue × 100.
Say you sell a shirt for $40 and it costs you $16 in blank garment, printing, and your supplier's base charge. Your gross profit is $40 − $16 = $24, and your gross margin is $24 ÷ $40 = 60%. Everything below is about pushing that $24 up.
There are only two ways to do it: make each order bring in more revenue, or make each order cost less to fulfill. We'll take them in order.
Lever 1: Raise price without losing the sale
Price is the fastest lever because it drops straight to gross profit — a dollar of price with no added cost is a dollar of gross profit.
Say you nudge that $40 shirt to $44 while COGS holds at $16. Gross profit goes from $24 to $44 − $16 = $28, and margin climbs from 60% to $28 ÷ $44 = 64%. That's a ten percent price increase turning into a roughly seventeen percent jump in gross profit per order.
The risk is volume. If a ten percent price rise costs you more than a proportional share of orders, total gross profit can fall even as per-order margin rises. Test price on a single product or a single traffic source before rolling it store-wide, and watch orders, not just margin.
Lever 2: Cut COGS — the POD-specific version
For a POD store, COGS is the blank garment plus the print charge plus the supplier's base fulfillment fee baked into the item. Each of those is negotiable or swappable.
Say you move a $16-COGS shirt to a comparable blank and print path that costs $13. On the same $40 price, gross profit rises from $24 to $40 − $13 = $27, and margin from 60% to $27 ÷ $40 = 67.5%. A $3 cost cut lands as $3 of pure gross profit — the same effect as a $3 price increase, but invisible to the customer.
Practical COGS levers for print-on-demand include:
- Comparing your provider's base cost per garment against alternatives before you scale a winning design.
- Consolidating orders or SKUs so you qualify for volume or premium-tier pricing.
- Switching high-volume products to a lower-cost blank when the quality difference is negligible.
- Auditing which products carry a hidden second print location or oversized print fee.
Because COGS is a share of every future sale, a small per-unit cut compounds across thousands of orders — often a bigger annual number than a one-time price test.
Lever 3: Fix your sales mix
You can improve blended gross margin without changing any single product — just sell more of the high-margin ones.
Say two products both sell at $40. Product A costs $16 (a 60% margin); Product B costs $24 (a 40% margin). If your ad spend and homepage push both equally, your blended margin sits between them. Shift traffic and inventory toward Product A and the store's overall gross margin rises even though no individual price or cost changed.
This is why margin-aware merchandising beats gut feel. Rank your catalog by gross profit per order, then feature, bundle, and advertise from the top of that list — not from whatever happens to be trending.
Lever 4: Grow average order value
Average order value (AOV) is revenue divided by orders. Raising it grows gross profit dollars per checkout, because you spread the same fixed handling over more margin.
Say your AOV is $40 at a 60% margin, so each order yields $24 of gross profit. Add a $15 companion item at the same 60% margin and the order now yields $24 + $9 = $33 of gross profit — a 37% lift with no new customer acquired. Bundles, "complete the set" upsells, and free-shipping thresholds all pull AOV up.
Free-shipping thresholds work partly because abandoned carts are so common: the long-run average documented cart abandonment rate sits near seventy percent, according to Baymard Institute. A threshold set just above your AOV gives hesitant buyers a reason to add one more item instead of leaving.
Gross profit isn't the profit you keep
Here's the part the ranking pages skip. Gross profit only subtracts COGS. It ignores shipping, payment fees, pick-and-pack labor, and ad spend — all of which come out of that $24 before any of it is yours.
Say your $24 gross-profit order also carries $5 shipping, $1.60 in payment processing, and $1.40 of pick/pack labor. Your contribution margin before ads is $24 − $8 = $16. Now allocate ad spend — say $10 per order at a 4.0 return on ad spend — and you're left with $16 − $10 = $6 of contribution margin after ads. That $6, not the $24, is what a scaling decision actually rides on.
This is why a great-looking gross margin can still hide an unprofitable channel. The metric that governs whether to spend more on ads is your per-order profit after every variable cost, not gross profit. For the full metric map, see our ecommerce metrics guide, and to work the last mile of that math use the cost-per-order calculator.
A worked example: stacking the levers
Levers compound. Take the $40 / $16-COGS order and apply two modest moves: raise price to $44 and cut COGS to $14.
Gross profit goes from $24 to $44 − $14 = $30 — a 25% gain from a ten percent price bump and a two-dollar cost cut, neither of which a customer would notice. On 1,000 orders a month, that's $6 × 1,000 = $6,000 more gross profit, every month, with no extra ad spend.
The order matters, though. Because ad efficiency is measured against margin, improving gross margin also lowers your break-even return on ad spend. On a contribution basis, break-even ROAS is 1 ÷ contribution-margin ratio — so a fatter margin means every ad dollar clears profit sooner. If you're tuning campaigns alongside pricing, our guides on the CPC formula and CTR calculator show how click costs feed the same equation.
Where PodVector fits
Improving gross profit requires knowing your real per-order cost, and that cost is scattered across tools. PodVector connects Shopify, Meta Ads, Google Ads, Printify, and Printful, then computes true per-order profit — COGS, shipping, fees, and ad allocation netted out on every order, not just gross margin.
Victor, PodVector's AI employee, analyzes that live data and proposes moves — a price test on a thin-margin SKU, a mix shift toward your best gross-profit products — and executes the ones you approve on the Shopify side. Victor reads your ad data to find where margin leaks, but he does not touch your ad account. He's not a dashboard; he's an employee that acts on the profit math with your sign-off.
See your true per-order profit with PodVector
FAQs
What is the fastest way to improve gross profit?
Price is usually fastest, because a dollar of price with no added cost is a dollar of gross profit. Test a modest increase on one product or one traffic source and watch order volume — if orders hold, per-order gross profit rises immediately. Cutting COGS is close behind and has the advantage of being invisible to customers.
Is it better to raise prices or cut costs?
Both land as gross profit dollar-for-dollar, so run whichever you can move without side effects. A price rise risks losing volume; a COGS cut risks a quality drop. In practice, a small cut on a high-volume product compounds across every future order, while a price test gives you a faster, reversible read on demand.
What's a good gross margin for an ecommerce store?
It varies widely by category, so benchmark against your own products rather than a single industry number. What matters more is the gap between gross margin and your contribution margin after shipping, fees, and ads — a healthy gross margin that collapses to near-zero after those costs signals a channel or pricing problem, not a healthy business.
Why did my gross profit fall even though margin went up?
Almost always volume. If a price increase lifted per-order margin but cost you more than a proportional share of orders, total gross profit drops. Track gross profit dollars and order count together, not margin percentage alone, so a "better margin" doesn't quietly shrink the business.
Does gross profit include shipping and ad spend?
No. Gross profit subtracts only COGS. Shipping, payment fees, fulfillment labor, and ad spend come out afterward to give contribution margin — the number that actually decides whether you can afford to scale a product or channel.