
If you run a print-on-demand store with real orders coming in, gross margin is the first number you should be able to recite from memory. It sets the ceiling on everything else — what you can spend to acquire a customer, how much discount you can stomach, and whether a hot-selling SKU is actually worth selling.
This guide walks the exact calculation with operating numbers, untangles the markup-versus-margin trap that wrecks POD pricing, and shows why a healthy gross margin can still hide a store that loses money on every order.
What is a gross margin?
A gross margin is the share of revenue left after you pay for the product itself — nothing else. For a POD store, "the product itself" means the blank garment, the print cost, and the supplier's base fulfillment charge baked into each item. Those three together are your cost of goods sold (COGS).
Gross margin is usually quoted as a percentage of revenue, which makes it comparable across products at different price points. A $25 mug and a $55 hoodie can both run a 60% gross margin even though the dollar profit is very different.
What gross margin does not include: shipping you pay the carrier, payment-processing fees, pick-and-pack labor, returns, or a single dollar of ad spend. Those live further down the P&L in contribution margin and operating margin. Gross margin answers one narrow question — "is this product worth making?" — and it answers it well.
How to calculate gross margin percentage
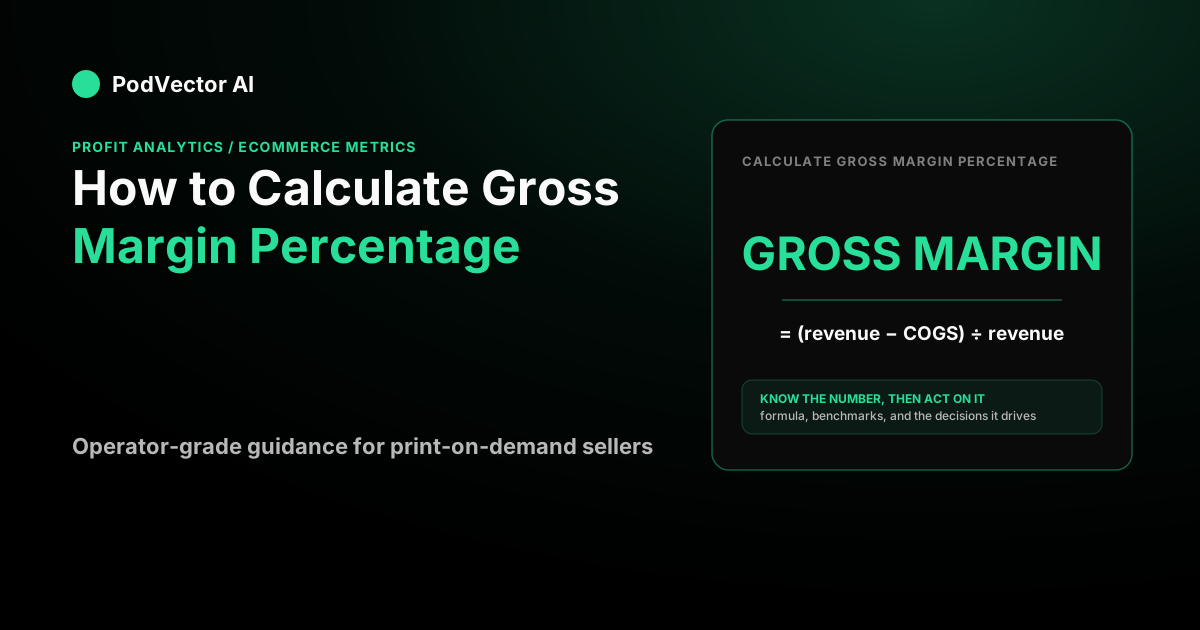
The formula has two steps. First find gross profit in dollars, then convert it to a percentage.
- Gross profit = Revenue − COGS
- Gross margin % = Gross profit ÷ Revenue × 100
Say you run a store doing 380 orders a month at a $40 average order value. Each order's COGS — blank tee, print, and the Printify or Printful base charge — comes to $16.80. Here is the per-order math:
| Line | Amount |
|---|---|
| Revenue (AOV) | $40.00 |
| − COGS (blank + print + supplier base) | −$16.80 |
| = Gross profit | $23.20 |
| Gross margin % ($23.20 ÷ $40.00 × 100) | 58% |
The same answer holds at the monthly level, which is how you should check your whole store. Revenue of 380 × $40 = $15,200, COGS of 380 × $16.80 = $6,384, so gross profit is $8,816 and gross margin is $8,816 ÷ $15,200 × 100 = 58%. Per-order and monthly give you the same percentage when your product mix is steady — if they diverge, your mix is shifting toward cheaper- or richer-margin SKUs.
One POD-specific trap: decide once whether the supplier's flat print fee lives in COGS or in fulfillment, and hold that line. Move it around between products and your gross margin numbers stop being comparable.
Gross margin ratio formula vs. markup
This is where POD sellers lose money, so read it twice. Markup and margin describe the same price-to-cost gap, but against different bases.
- Markup % is the gap over your cost: (Price − Cost) ÷ Cost × 100.
- Margin % is the gap over your price: (Price − Cost) ÷ Price × 100.
Take the same $40 item costing $16.80. The markup is ($40 − $16.80) ÷ $16.80 × 100 = 138%. The margin is ($40 − $16.80) ÷ $40 × 100 = 58%. Same $23.20 gap, two very different percentages.
Suppliers and marketplaces usually quote markup; your P&L and every benchmark quote margin. If you set a "60% markup" thinking you locked in a 60% margin, you actually booked a 37.5% margin — and you will wonder why the money never shows up. When you read the gross margin ratio formula, confirm the denominator is price, not cost.
What is a good gross margin for a print-on-demand store?
There is no universal number, but public benchmarks give you a yardstick. The median direct-to-consumer gross margin in 2026 was 56.6%, with the middle of the pack running roughly 45.6% to 63.8%, according to eightx's analysis of eleven publicly traded DTC and CPG brands' 10-K filings. Those are blended brands with their own manufacturing, so treat the band as context, not a target.
The example store above, whose margin we worked out earlier, sits just above that median. For POD specifically, your gross margin lives or dies on the supplier base cost, which you know before the first sale ever happens — the blank and print charge from Printify, Printful, or Gelato is published, not discovered later. That means you can model your margin on day one and reprice before a thin SKU ever drains cash.
If your gross margin sits well below the 45.6% mark, the problem is usually pricing or supplier choice, not ad spend. No amount of marketing fixes a product that barely clears its own cost.
Why gross margin alone can hide a losing store
Here is the part the generic accounting pages skip. A 58% gross margin feels safe, but gross margin stops counting at COGS — and your real costs do not.
Keep the $40 order and strip out the rest of the variable costs. Carrier shipping runs $4.50, payment processing at 3% is $1.20, and pick-and-pack labor is $1.00. That $6.70 turns your $23.20 gross profit into a contribution margin of $16.50, or about 41% of revenue. Now allocate ad spend: a store spending roughly $3,800 a month across 380 orders carries $10 of ad cost per order, leaving just $6.50 — about 16% of revenue — as true per-order profit before any fixed costs.
The gross margin said 58%. The dollar that actually survives to pay your rent and software is closer to 16 cents. This gap is exactly why a break-even ROAS of 1 ÷ 0.58 ≈ 1.7 (on gross margin) is a dangerous number to run ads against — the honest break-even sits near 1 ÷ 0.41 ≈ 2.4 once shipping and fees are in. Use gross margin to judge the product; use contribution margin to judge whether to scale the channel.
This is where most POD owners lose the thread: gross margin lives in your supplier dashboard, ad cost lives in Meta, fees live in Shopify, and nobody stitches them into one per-order number. PodVector AI puts Victor, an AI employee, on exactly that job — Victor sees every order, every ad dollar, and every supplier cost from Printify, Printful, and Gelato together, so he computes the true per-order profit on each product, not just the flattering gross margin. When a SKU's real margin goes thin, Victor reprices it in Shopify and trims the ad sets that are spending against it, then delivers the profit report to your Google Drive.
Lifting that true per-order profit is a pricing-and-basket problem as much as a cost problem — one of the fastest levers is raising average order value so fixed shipping and fees spread across more revenue. For the full map of how gross margin connects to CAC, ROAS, and contribution margin, work through the ecommerce metrics guide.
Want the true per-order profit on every SKU without building the spreadsheet yourself? Put Victor on your store.
FAQs
What is the gross margin ratio formula?
The gross margin ratio is gross profit divided by revenue: (Revenue − COGS) ÷ Revenue. Multiply by 100 to express it as a percentage. For a $40 order costing $16.80 in blank, print, and supplier fees, that is $23.20 ÷ $40 = 0.58, or 58%. The "ratio" and the "percentage" are the same calculation — the ratio is just the decimal before you multiply by 100.
What is the difference between gross profit and gross margin?
Gross profit is a dollar figure; gross margin is that figure as a percentage of revenue. On the $40 order, gross profit is $23.20 and gross margin is 58%. You use gross profit to see total dollars earned and gross margin to compare products or periods on a level footing, regardless of price.
Is a 50% gross margin good for ecommerce?
It depends on your category, but 50% sits just under the 2026 DTC median of 56.6% reported in eightx's 10-K benchmark. For POD, 50% gross margin often leaves too little room once shipping, fees, and ad spend come out — many stores need 55% or more at the gross line just to clear a healthy contribution margin after acquisition costs.
Why is my gross margin high but my bank account empty?
Because gross margin stops at COGS and ignores shipping, payment fees, fulfillment labor, returns, and ad spend. A 58% gross margin can collapse to a mid-teens contribution margin once those variable costs hit, as the worked example above shows. If your margin looks strong but cash is tight, your ad spend or shipping is eating the difference — track contribution margin per order, not just gross margin.
How do I calculate gross margin for a single POD product before I launch it?
You do not need sales history — POD supplier costs are published up front. Take your planned sell price, subtract the blank, print, and base fulfillment charge from Printify, Printful, or Gelato, divide by the sell price, and multiply by 100. That gives you the product's gross margin before the first order, so you can price for the margin you actually want instead of discovering it later.