
What the gross margin ratio actually measures
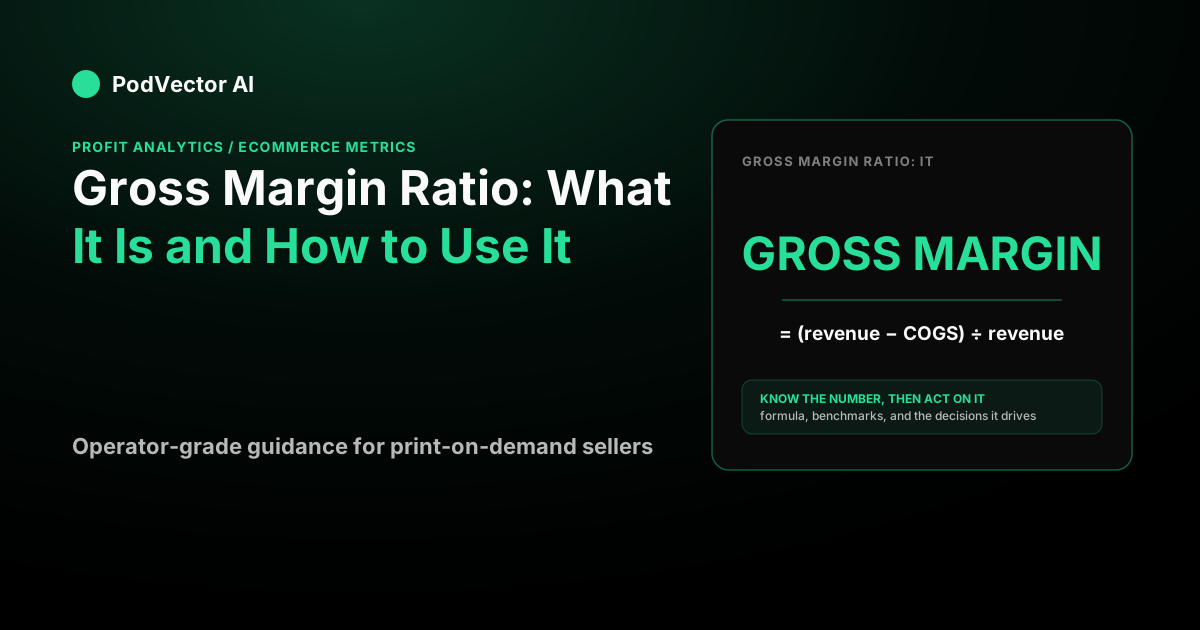
The gross margin ratio is gross profit expressed as a percentage of revenue. Gross profit is the dollar amount; the ratio is the percentage. People use "gross margin" for both, but the ratio is what lets you compare a $34 tee to a $58 hoodie on the same footing.
The formula is the same everywhere:
Gross margin ratio = (Revenue − COGS) ÷ Revenue × 100
COGS (cost of goods sold) is the direct cost of making the thing you sold. For print-on-demand, that is the blank garment plus the print charge your supplier bakes into the item — the number Printify, Printful or Gelato shows you before a single order ships. It is not shipping, not ad spend, not your Shopify subscription.
Say you sell a tee for $34 and your Printify cost is $13.60. Your gross profit is $20.40, and your gross margin ratio is $20.40 ÷ $34 = 60%. That 60% is the pool every other cost gets paid out of.
How to calculate it for your store
Pull one real month instead of guessing. Here is an example store doing 420 orders at the same $34 price used above.
- Revenue:
420 × $34 = $14,280 - COGS:
420 × $13.60 = $5,712 - Gross profit:
$14,280 − $5,712 = $8,568 - Gross margin ratio:
$8,568 ÷ $14,280 = 60%
The per-order math and the monthly math give the same ratio — that is the point. Once you know your blended COGS, the ratio holds whether you sell ten tees or ten thousand. If you want the step-by-step version with net sales and returns handled properly, the full gross profit margin walkthrough covers the edge cases this quick version skips.
One scope decision matters: does the supplier's flat print fee sit in COGS or in fulfillment? Either is defensible. Pick one and never move it, or your ratio will drift month to month for no real reason.
What counts as a good gross margin ratio
There is no magic number, but industry data gives you a sane reference point. Shopify's breakdown of NYU Stern's January 2026 industry averages puts the apparel sector at a 56.88% average gross margin — yet the same companies average just a 3.85% net margin after everything else. That gap is the whole lesson: a healthy gross margin ratio is normal, and it still leaves thin profit at the bottom.
For online stores specifically, directional benchmarks land lower. One industry roundup of average gross margins by category pegs first-party ecommerce retail at roughly 20% to 45%, noting that last-mile costs often sit outside COGS and returns quietly erode the realized margin.
Print-on-demand usually lands on the higher end of apparel because you carry no inventory and pay per item — but your per-unit cost is also higher than a bulk-buying brand's. A 55% to 65% gross margin ratio is a common operating zone for POD apparel. Below about 50%, you have very little room to run paid ads profitably.
Why the gross margin ratio is a ceiling, not a verdict
This is where most articles stop and most sellers get burned. A 60% gross margin ratio does not mean you keep 60 cents on the dollar. It means you keep 60 cents before the costs that actually sink POD stores.
Walk that same $34 tee all the way down:
- Revenue: $34.00
- − COGS (Printify): −$13.60 → gross margin ratio 60%
- − Shipping: −$4.50
- − Payment processing (about 3%): −$1.02
- − Pick/pack handling: −$0.90
- = Contribution margin before ads: $13.98 (a 41% ratio)
- − Ad cost per order (at a 4.0 ROAS, $34 ÷ 4.0): −$8.50
- = Profit after ads: $5.48 (a 16% ratio)
Same order, three very different "margins." The gross margin ratio was 60%; the number you actually bank is closer to 16%. Returns make it worse — the National Retail Federation's 2025 data, summarized in this ecommerce return-rate breakdown, puts the average online return rate at 19.3%, and apparel runs higher than that. Every returned order eats its COGS and shipping with no revenue to offset it.
The one place the gross margin ratio decides everything
Your gross margin ratio sets your break-even ROAS — the return on ad spend where ads exactly pay for themselves. The identity is simple:
Break-even ROAS = 1 ÷ margin ratio
On a 60% gross margin ratio, break-even ROAS is 1 ÷ 0.60 = 1.67. But that ignores shipping and fees. Use the 41% contribution margin instead and the honest break-even is 1 ÷ 0.41 = 2.4. That is the ROAS your campaigns must clear just to avoid losing money — and it is why two stores with the same ROAS can have opposite bank balances. Knowing where your real break-even sits is the same muscle as knowing your break-even point in orders.
The lower your gross margin ratio, the higher the ROAS you are forced to hit, and the less headroom you have to scale. This is the single most useful thing the ratio tells a paid-media operator.
How to lift your gross margin ratio
Three levers move it, and only three:
- Raise price. The fastest lever. Going from $34 to $38 on a $13.60 cost pushes the ratio from 60% to 64% with zero new cost.
- Cut COGS. Switch suppliers, consolidate on fewer blanks, or move volume to a provider with a lower base charge. Every dollar off COGS is a dollar straight into gross profit.
- Shift the mix. Sell more of your high-margin SKUs. A small nudge toward higher-ticket items also lifts your average order value, which spreads shipping and handling across more revenue.
The trap is watching the gross margin ratio in isolation. It is one gauge on a dashboard of many — see how it fits alongside contribution margin, ROAS and net margin in the ecommerce metrics guide.
Where Victor fits
Gross margin ratio is easy to define and brutal to track by hand, because the inputs live in different places: your price is in Shopify, your product cost is in Printify, Printful or Gelato, and your ad spend is in Meta and Google.
Victor is the AI employee inside PodVector AI who pulls those together. He knows each product's true cost from your print-provider connection before the first sale, computes the real per-order profit once shipping, fees and ad spend are in, and reprices the thin-margin SKUs in Shopify when the ratio slips. When a campaign runs below its break-even ROAS, Victor pauses the losing ad set in Meta or Google and shifts budget to the products that actually clear their margin. He delivers the margin report to your Google Drive so the number is in front of you, not buried in a spreadsheet.
Victor is not a dashboard you have to read — he does the work the ratio implies. Put Victor on your store and let him watch the margin on every order.
FAQs
Is gross margin ratio the same as gross profit margin?
Yes — "gross margin ratio" and "gross profit margin" both name the same percentage: gross profit divided by revenue. The only real distinction is that "gross profit" sometimes refers to the raw dollar amount, while the ratio is always the percentage.
What is a good gross margin ratio for a print-on-demand store?
Most POD apparel stores run between 55% and 65% because they pay per item and carry no inventory. For context, Shopify's summary of NYU Stern data shows the broad apparel sector averaging about 57%. Below 50%, profitable paid advertising gets very hard.
Does gross margin ratio include shipping and ad spend?
No. Gross margin ratio only subtracts COGS — the direct cost of the product. Shipping, payment fees and ad spend come out of the gross profit afterward. That is why a 60% gross margin ratio often becomes a 15% to 20% profit margin by the time the order is fully accounted for.
Why is my gross margin ratio high but my profit low?
Because the ratio is a ceiling, not the final number. A high gross margin ratio means your product cost is low relative to price, but shipping, processing fees, returns and especially ad spend all get paid out of that margin. The average online return rate alone sits near 20%, and returned orders carry cost with no revenue.
How does gross margin ratio affect my ad budget?
Directly. Your break-even ROAS equals 1 divided by your margin ratio. A 60% gross margin ratio means ads break even at a 1.67 ROAS on paper — but once you net out shipping and fees, the honest break-even is closer to 2.4. The thinner your margin, the higher the ROAS you must hit before ads turn a profit.
Should I track gross margin ratio or contribution margin?
Track both. Gross margin ratio tells you whether a product is worth making; contribution margin — revenue minus every variable cost including ads — tells you whether it is worth selling through a given channel at your current acquisition cost. Scaling decisions live in contribution margin.