
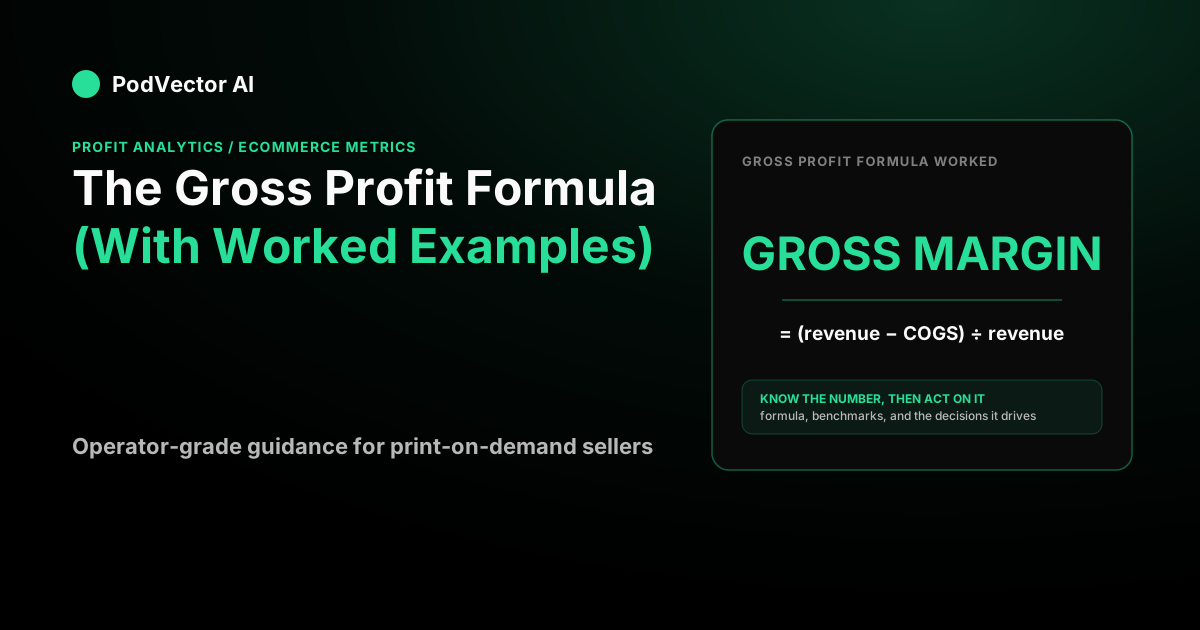
Gross profit = revenue − cost of goods sold (COGS). It is the money left from a sale after you pay for the product itself, before shipping, ad spend, payment fees, or overhead. As a percentage, gross margin = (revenue − COGS) ÷ revenue × 100. On a $40 order that costs $16 to make, gross profit is $40 − $16 = $24, and gross margin is 60%.
Almost every guide gives you that one line and stops. The formula is the easy part. The hard part is knowing what belongs in COGS, how gross profit differs from the profit you actually keep, and why a healthy-looking gross margin can still hide a money-losing order. This walks all of it with real numbers.
The gross profit formula, defined
Gross profit measures how much money a sale generates after the direct cost of the thing you sold. Two inputs, one subtraction:
- Revenue — the price the customer paid (before refunds and discounts, or net of them if you want a truer read).
- COGS (cost of goods sold) — the direct cost to produce or acquire that unit.
So: gross profit = revenue − COGS. Everything downstream — contribution margin, net profit, break-even — starts from this number, which is why getting COGS right matters more than the arithmetic.
A worked example: one print-on-demand order
Say you run a print-on-demand apparel store and sell a T-shirt for $40. Your supplier charges $16 to make and ship-ready that shirt — the blank garment, the print, and the base fulfillment cost baked into the item.
Your gross profit on that order is $40 − $16 = $24. That is the money the sale "created" before you spend anything to sell it or run the business.
As a percentage — the version investors and dashboards quote — gross margin is ($40 − $16) ÷ $40 = 60%. Same store, same order, two ways to say it: $24 of gross profit, or a 60% gross margin. Keep both handy, because the dollar figure tells you scale and the percentage tells you efficiency.
Gross margin vs. gross profit
People use these interchangeably, but they answer different questions.
- Gross profit is a dollar amount: $24 per order.
- Gross margin is a ratio:
(revenue − COGS) ÷ revenue, or 60% here.
Margin is what lets you compare a $40 shirt to a $120 hoodie fairly — the dollars differ, but the percentage tells you which product is structurally more efficient. It also feeds directly into break-even math: a store on a 60% gross margin needs ad revenue of 1 ÷ 0.60 = 1.67× its ad spend just to cover product cost and the ads themselves. Lower your margin and that break-even bar rises fast. You can go deeper on the ratios that build on margin in our ecommerce metrics guide.
The trap: gross profit is not the profit you keep
Here is what the one-line formula quietly leaves out. That $24 of gross profit is not yours yet — it is the pool every other cost gets paid from. Watch it drain on the same order:
Start with the $24 gross profit. Subtract the carrier shipping you eat, say $5: $24 − $5 = $19. Subtract payment processing at roughly 4% of the $40 order, so $1.60: $19 − $1.60 = $17.40. Subtract pick-and-pack labor of $1.40: $17.40 − $1.40 = $16.
That $16 is your contribution margin — profit after all variable costs, before advertising. A 60% gross margin just became a 40% contribution margin, and you have not spent a cent on ads yet.
Now allocate ad spend. If you acquire orders at a 4.0 return on ad spend, that is $10 of ad cost per $40 order: $16 − $10 = $6. Your real margin after ads is 15% — a quarter of the gross margin you started with. This gap is exactly why gross profit alone can flatter a business into scaling something unprofitable. If you want the full breakdown of variable-cost profit, see how to calculate contribution margin and the practical step-by-step version.
Gross profit vs. net profit
Net profit takes it one final step, subtracting fixed costs — rent, salaries, software, retainers — that do not scale per order.
Say those fixed costs run $4,000 a month, and you did 1,000 orders at $6 of post-ad margin each, so $6,000 total. Net profit is $6,000 − $4,000 = $2,000, a 5% net margin on $40,000 of revenue. That is the number that tells you whether the business made money. Gross profit tells you whether the product is worth making; net profit tells you whether the company is working.
What counts as COGS (and what doesn't)
The formula only works if COGS is scoped consistently. Include direct product costs: the blank, the print, materials, and any per-unit fulfillment charge the supplier bakes into the item. That is what makes it "cost of goods sold."
Do not put marketing, salaries, or office rent in COGS — those are operating costs that belong below gross profit. The tricky one for print-on-demand is the supplier's flat print fee: you can treat it as COGS or as fulfillment, and either is defensible. Just pick one and hold it, because flip-flopping makes your gross margin and break-even numbers silently contradict each other from month to month.
Is a 60% gross margin good?
For direct-to-consumer and print-on-demand, yes — a gross margin in the low-to-mid sixties is a healthy, scalable place to be. Print-on-demand stores tend to land in the sixty to sixty-five percent gross-margin range, according to TrueProfit's analysis of ecommerce stores, with the broader ecommerce sweet spot for profitable scaling sitting between sixty and seventy percent in the same analysis. Below roughly fifty-five percent, growth gets fragile fast — there is simply not enough gross profit to absorb shipping, fees, and ad spend and still leave net profit.
But "good gross margin" is a starting condition, not a verdict. As the walk-through above shows, a great gross margin paired with an expensive acquisition cost can still net out to a loss on the order. The real test is what survives after ads — which is why savvy operators track CPA vs. CAC alongside margin, not instead of it.
How to actually see per-order gross profit
The math is simple; getting clean inputs is not. Your product cost lives in your supplier's system, your fees live with your processor, your ad spend lives in Meta and Google, and your revenue lives in your store. Most sellers stitch these together in a spreadsheet once a quarter and hope the COGS number is current.
This is the gap PodVector closes. It connects Shopify, Meta Ads, Google Ads, Printify, and Printful, then computes true per-order profit — revenue minus product cost, fees, shipping, and allocated ad spend — so you see the $6, not just the $24. Victor, its AI employee, analyzes that live data and can act on it Shopify-side with your approval; he reads your ad data and proposes moves but does not touch your ad account. It is not a dashboard you have to interpret — the profit number is computed for you. Because retention quietly stretches lifetime value and changes what you can afford to spend acquiring an order, pairing profit visibility with work on improving your churn rate is where the compounding happens. See your true per-order profit with PodVector.
FAQs
What is the gross profit formula?
Gross profit = revenue − cost of goods sold (COGS). Revenue is what the customer paid; COGS is the direct cost to produce or acquire the unit. On a $40 order that costs $16 to make, gross profit is $40 − $16 = $24.
What is the difference between gross profit and gross margin?
Gross profit is a dollar amount ($24 per order); gross margin is that same figure as a percentage of revenue, (revenue − COGS) ÷ revenue, or 60% on the $40 order. Use dollars to see scale and the percentage to compare products or periods fairly.
Does gross profit include shipping and taxes?
Generally no. Gross profit subtracts only COGS — the direct product cost. Shipping, payment fees, and fulfillment labor come out below gross profit, at the contribution-margin line, and taxes come out further down still. That is why gross profit overstates the money you actually keep.
Is a 60% gross margin good for ecommerce?
For most ecommerce and print-on-demand stores it is healthy. Print-on-demand typically runs a sixty to sixty-five percent gross margin, according to TrueProfit, with sixty to seventy percent cited as the range that makes profitable scaling possible. But a strong gross margin can still turn into a per-order loss once acquisition cost is included, so check margin after ads too.
How do I calculate gross profit margin as a percentage?
Divide gross profit by revenue and multiply by 100: (revenue − COGS) ÷ revenue × 100. For the $40 shirt costing $16, that is ($40 − $16) ÷ $40 × 100 = 60%.
Why is my gross profit high but my net profit low?
Because gross profit only removes product cost. Shipping, processing fees, pick-and-pack, ad spend, and fixed overhead all get paid out of gross profit afterward. A 60% gross margin can shrink to a 40% contribution margin, then 15% after ads, then a low single-digit net margin once rent and salaries are covered.