
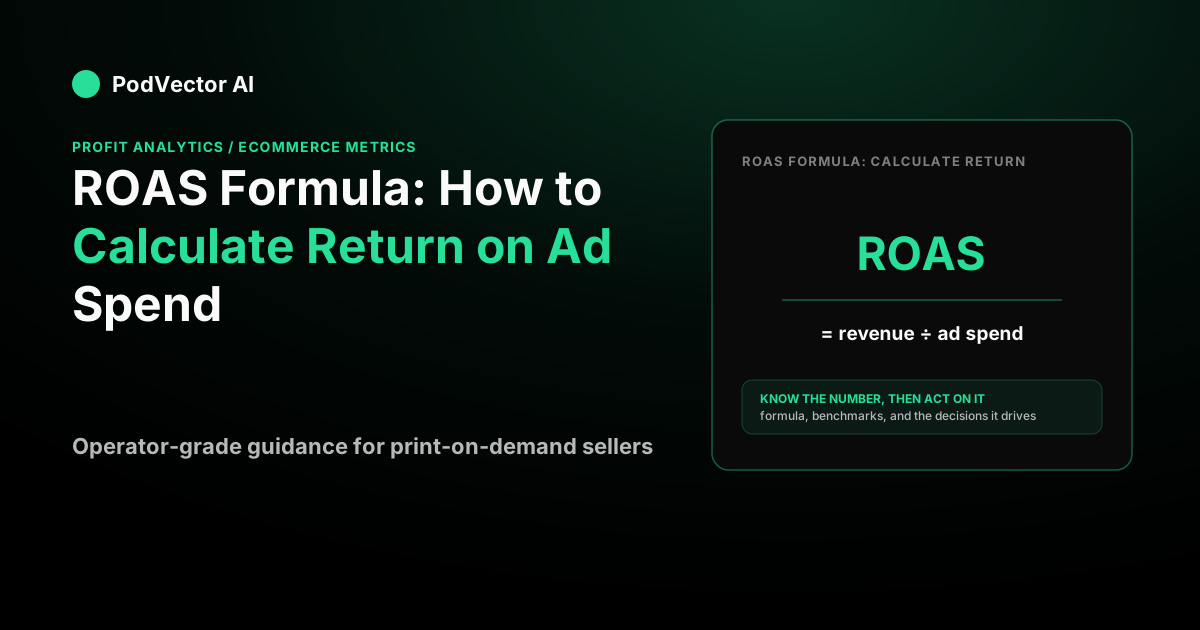
The ROAS formula, stated plainly
Return on ad spend answers one question: for every dollar you put into ads, how many dollars of revenue came back?
ROAS = Revenue attributed to ads ÷ Ad spend
The result is a ratio. A ROAS of 4.0 means each ad dollar returned four revenue dollars. You will also see it written as 4:1 or as 400% — same number, three costumes. To get the percentage, multiply the ratio by 100.
Say you run a print-on-demand store and spend $10,000 across Meta and Google in a month. Those campaigns drive $40,000 in tracked sales. Your ROAS is 40,000 ÷ 10,000 = 4.0. Clean and simple.
That simplicity is exactly why ROAS gets misused. The formula never asks what those sales cost you to fulfill. It treats a $40 order the same whether the product cost you $8 or $38.
How to calculate ROAS, step by step
You need two numbers, and getting them right matters more than the division.
- Ad spend. Total the amount you paid the platform over the window you care about — a campaign, a channel, or the whole month. Use the platform's billed spend, not a rounded budget.
- Attributed revenue. Pull the revenue the platform credits to those ads. On Meta this is "purchases conversion value"; on Google it is "conversion value."
- Divide attributed revenue by ad spend.
So if a single campaign spent $2,500 and reported $9,000 in conversion value, that campaign's ROAS is 9,000 ÷ 2,500 = 3.6.
One trap lives in step two. Ad platforms grade their own homework — each one claims credit for conversions it may have only touched. If Meta claims sixty orders and Google claims fifty on the same hundred orders, adding them double-counts and inflates every channel's ROAS. That is why savvy operators also track a blended number (more on that below) and why cost math like the cost per order formula is worth running alongside ROAS.
What counts as a good ROAS?
There is no universal "good" number, but there are anchors. A widely cited benchmark is 4:1 — four dollars of revenue per ad dollar, per the ROAS reference at Omnicalculator. Across ecommerce broadly, the average runs lower: roughly $2.87 back per ad dollar, according to Trendtrack's ecommerce ROAS benchmarks.
But the honest answer is that averages are close to useless for your store. A 4.0 ROAS is a triumph for a low-margin reseller and a slow bleed for a high-cost custom product. What separates the two is your break-even point — and that has nothing to do with the industry average.
Break-even ROAS: the number that actually protects you
Break-even ROAS is the ROAS at which ad-driven revenue exactly covers your costs, leaving zero profit. Below it you lose money; above it you make some. The formula is short:
Break-even ROAS = 1 ÷ contribution-margin ratio
The lower your margin, the higher the ROAS you must clear just to avoid losing money. For products with fifty-percent margins you need about a 2:1 ROAS to break even, while twenty-five-percent-margin products need roughly 4:1, as Trendtrack lays out in its break-even discussion.
Here is the subtlety most guides miss: which margin do you use? Gross margin (revenue minus product cost) gives you a flattering, too-low break-even. The honest version uses your contribution margin — product cost plus shipping, payment fees, and pick-and-pack — because those all scale with every order too.
Say your average order looks like this, as an illustration:
- Revenue: $40.00
- Product cost (blank, print, base fulfillment): −$16.00 → 60% gross margin
- Shipping: −$5.00
- Payment processing: −$1.60
- Pick and pack: −$1.40
- Contribution margin before ads: $16.00, a 40% ratio
On gross margin, break-even ROAS is 1 ÷ 0.60 = 1.67. On the honest 40% contribution ratio, it is 1 ÷ 0.40 = 2.5. That gap is the difference between "we're crushing it" and "we're barely above water." If you want to keep a 15% margin after ads, you'd target roughly 1 ÷ (0.40 − 0.15) = 4.0 — which is why 4:1 feels like a magic number for stores with these economics. Working your true per-unit costs through the contribution margin formula and the gross profit formula is what makes your break-even ROAS real instead of a guess.
ROAS vs POAS: the profit number ROAS hides
Here is the punchline the top-ranking calculators dance around: ROAS measures revenue, not profit. You can hit a great ROAS and still lose money on every sale.
Profit on ad spend (POAS) fixes this by swapping the numerator:
POAS = Profit attributed to ads ÷ Ad spend
And there's a clean shortcut, because profit is just revenue times your margin ratio:
POAS = ROAS × margin ratio
Take that 4.0 ROAS on the store above. On a 60% gross margin, POAS = 4.0 × 0.60 = 2.4 — every ad dollar returns $2.40 of gross profit. Healthy. Now imagine the same 4.0 ROAS on a thin-margin product where the margin ratio is far lower; the POAS collapses toward 1.0, where you're just recycling cash. Same ROAS, opposite outcome. POAS crosses 1.0 at exactly the break-even ROAS, which is why it's the truer scoreboard.
The one-line rule: ROAS tells you if the ad worked; POAS tells you if the sale was worth making.
Blended ROAS and MER: seeing past attribution
Because each platform over-claims, per-channel ROAS is optimistic by design. Two store-wide numbers cut through it:
- Blended ROAS = total revenue ÷ total ad spend. It can't double-count, because it never splits credit by channel. For the store above, 40,000 ÷ 10,000 = 4.0.
- MER (marketing efficiency ratio) = total revenue ÷ all marketing spend, including tools, email platforms, and freelancers. If total marketing were $12,500, MER = 40,000 ÷ 12,500 = 3.2. MER is always at or below blended ROAS because its denominator is bigger.
Use per-channel ROAS to optimize a channel. Use blended ROAS and MER to judge whether the whole marketing engine is actually profitable. When the two diverge sharply, your platforms are claiming credit for sales that would have happened anyway.
A full worked example, revenue to profit
Say you spend $5,000 on a campaign and it drives 250 orders at $40 each — $10,000 in revenue.
- ROAS = 10,000 ÷ 5,000 = 2.0. On its own, that looks mediocre.
- Contribution margin per order (from the breakdown above) = $16, so total contribution = 250 × $16 = $4,000.
- Ad spend = $5,000. Contribution after ads = 4,000 − 5,000 = −$1,000.
The campaign is losing a thousand dollars despite a 2.0 ROAS, because break-even here was 2.5. Now flip it: at a 3.5 ROAS on the same spend, revenue is $17,500 — that's about 437 orders — contribution is 437 × $16 = about $6,990, minus $5,000 ad spend = roughly $1,990 in profit. The formula didn't change — only whether you cleared break-even did.
Where PodVector fits
The reason ROAS misleads is that the number lives on your ad platform, while the costs that decide whether a sale was profitable live in Shopify, and your POD supplier. Most operators never join those two worlds, so they optimize to a revenue ratio and wonder why the bank balance doesn't follow.
PodVector connects Shopify, Meta Ads, Google Ads, Printify, and Printful, then computes true per-order profit — the number underneath POAS and break-even ROAS. Victor, its AI employee, reads that live data, flags where a strong ROAS is hiding a weak POAS, and proposes moves; he acts on the Shopify side only, with your approval, and does not touch your ad account. He isn't a dashboard you have to interpret — he analyzes the joined data for you.
If you want your ROAS translated into actual profit per order, connect your stack and let Victor do the math.
For the full map of how ROAS relates to CAC, LTV, contribution margin, and the rest, the ecommerce metrics guide is the hub. And since conversion rate is half of what makes an ad dollar pay off, the Shopify checkout conversion rate breakdown pairs naturally with this one.
FAQs
What is the ROAS formula?
ROAS = revenue attributed to ads ÷ ad spend. If ads drove $8,000 in revenue on $2,000 of spend, ROAS is 4.0, also written 4:1 or 400%. Multiply the ratio by 100 to express it as a percentage.
Is a 4:1 ROAS good?
It depends entirely on your margins. 4:1 is a common benchmark, per Omnicalculator, and it's healthy for a store with strong contribution margins. But on a thin-margin product, a 4:1 ROAS can sit right at or below break-even. Always compare your ROAS to your own break-even ROAS, not to an industry average.
How do you calculate break-even ROAS?
Break-even ROAS = 1 ÷ your contribution-margin ratio. If your contribution margin is 40% of revenue, break-even is 1 ÷ 0.40 = 2.5. Use contribution margin (product cost plus shipping, fees, and fulfillment), not gross margin, or you'll set the bar too low.
What's the difference between ROAS and POAS?
ROAS measures revenue per ad dollar; POAS measures profit per ad dollar. POAS = ROAS × your margin ratio. A campaign can post a fine ROAS and a losing POAS if margins are thin — POAS is the number that tells you whether the sale was actually worth making.
Why is my blended ROAS lower than my platform ROAS?
Because each ad platform claims credit for conversions it may have only partly influenced, so per-channel ROAS is inflated. Blended ROAS (total revenue ÷ total ad spend) can't double-count, so it's usually lower and more honest. A large gap means your platforms are over-attributing.
Does ROAS include profit?
No. ROAS uses revenue in the numerator, so it ignores product cost, shipping, fees, and fulfillment. That's its biggest weakness. To bring profit into the picture, use POAS or check your ROAS against a break-even ROAS built from your true contribution margin.
What is a healthy cart abandonment rate to factor in?
Even good stores lose most carts — the long-run ecommerce cart abandonment rate sits around seventy percent, according to the Baymard Institute. Since abandoned checkouts waste the ad spend that drove the click, lowering abandonment directly improves the ROAS you can achieve on the same budget.