
What the average Meta ads CPM actually is in 2025
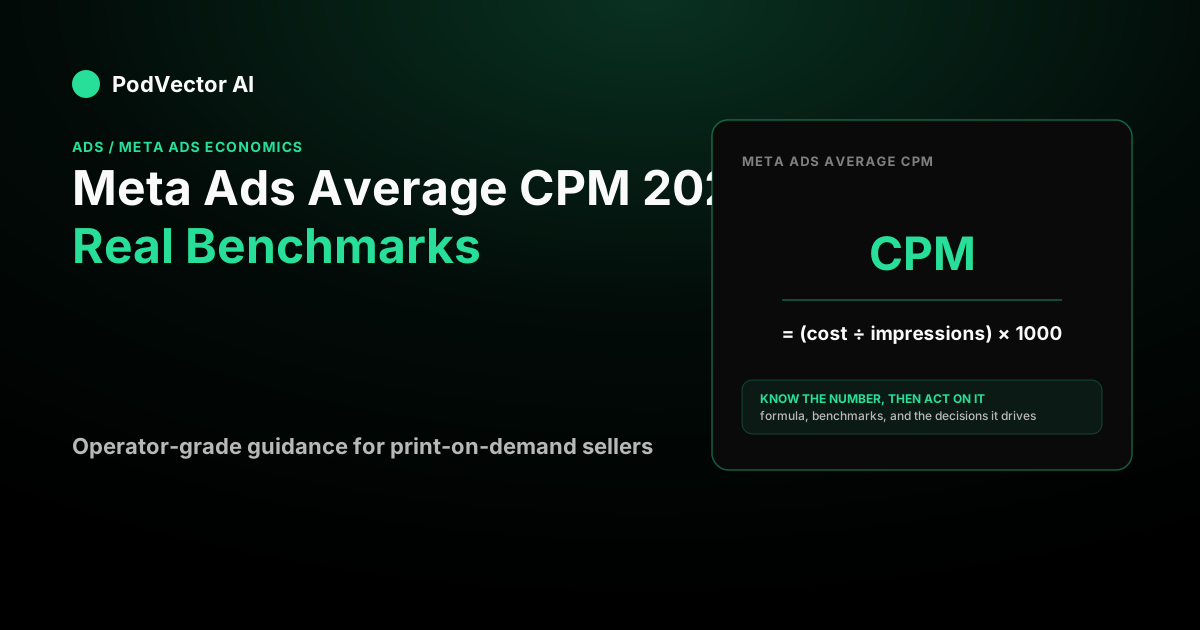
CPM is the cost per thousand impressions — the price Meta charges to put your ad in front of a thousand feeds. It is the entry ticket, not the outcome.
The headline numbers vary by source. One dataset of thousands of accounts puts the global average at $5.97, with top performers near $6.81. A Databox-based figure lands lower at $5.61 across all industries. Practitioner guides instead quote a healthy range of $8–$15.
So which is right? For a POD store running conversion campaigns to US shoppers, plan around the higher end. The same ecommerce segment in that first dataset shows a CPM of $10.76, and US CPMs specifically rose sharply year over year.
Why the benchmark numbers disagree so much
If you have read three "average CPM" posts and gotten three different answers, you are not confused — the sources genuinely measure different things.
Global averages pull in cheap-impression regions and awareness campaigns, dragging the number down. US-only conversion data sits far higher. One report shows US CPM climbing from $10.84 to $19.66, an 81.46% jump, while another notes CPM actually fell from about $6.30 in 2023 to $5.61 on a global basis.
Both can be true at once. The lesson: never adopt a benchmark without checking its geography, its objective, and its time window. A number built from a different market than yours is noise. Our Meta ads economics guide walks through how these metrics connect end to end.
CPM by objective: awareness is the cheap seat
Your campaign goal changes your CPM more than almost anything else, because Meta charges you to reach the kind of person your objective requires.
One US benchmark set breaks it out clearly: reach and impression campaigns run about $10–$15, lead generation runs $25–$40, and sales campaigns to new audiences run $10–$15 while remarketing climbs to $30–$50.
Notice the pattern. Awareness and cold prospecting are the cheap seats because Meta can show your ad to almost anyone. Remarketing is expensive per thousand impressions because the audience is tiny and you are bidding against yourself to reach the same warm shoppers again. A rising CPM on a retargeting audience is often just a small audience, not a broken ad.
CPM by industry and vertical
Vertical matters, and POD apparel sits in one of the hotter lanes.
Across industries, one report shows ecommerce at $10.76 and finance near $18.45, with food and beverage far cheaper at $2.82. A separate source puts manufacturing lowest at $2.40 and technology highest at $9.89. And apparel specifically has been inflating fast — one analysis reports apparel and food-and-beverage CPMs rising 50% to 80%, with art and baby products spiking above $18 to $20.
If you sell printed tees, mugs, or wall art, expect your CPM to run higher than the global "average" and to climb in Q4 when the auction floods. That is auction density — more advertisers bidding for the same feeds — not a flaw in your ad. For the full matrix, see our breakdown of Meta ads benchmarks by industry for CPC, CTR, CPM, and CPA.
Why CPM alone can't tell you if you're profitable
Here is the part every benchmark post skips. CPM is three steps removed from profit, and a "good" CPM can still lose you money.
Say you run a store doing 340 orders a month at a $31 average order value, with $2,800 a month in Meta spend. After product cost, shipping, and transaction fees, your contribution margin is 45% — so each order throws off about $31 × 0.45 = $13.95 in gross profit before ad spend.
Now walk your CPM down to a per-order cost. Suppose your account runs a $14 CPM with a 2% link CTR and a 3% landing-page conversion rate. That $14 buys 1,000 impressions, which produce 20 clicks (2% of 1,000), which produce 0.6 orders (3% of 20). Your cost per order is $14 ÷ 0.6 = $23.33.
That is the problem in one line: a perfectly normal $14 CPM produced a $23.33 cost per order against $13.95 of gross profit. You are losing about $9.38 on every sale while your CPM looks "fine."
The fix is rarely the CPM. It is the margin and the conversion math underneath it. Lift AOV with a bundle or a post-purchase upsell, raise CVR with a better landing page, or improve CTR with stronger creative — and the same CPM suddenly clears. The clean rule: your break-even ROAS equals 1 ÷ contribution margin, so at 45% margin you need 1 ÷ 0.45 = 2.22x just to break even. Our guide to a good ROAS for Facebook ads turns this into a target you can actually manage against.
What actually moves your CPM
Two very different things push your CPM around, and diagnosing which one is the whole game.
External pressure is auction density — seasonality, Q4 and BFCM, and competitors entering your niche. It hits everyone and is not your fault; you widen your audience or geo, or you accept a seasonal cost. Internal pressure is ad-quality decay — rising negative feedback, weak relevance, or a narrow audience you have saturated, which pushes your frequency and your cost per result up together.
The check is simple. If your CPM is up while CTR and conversion rate hold steady, the market got more expensive. If CPM is up and CTR is falling, your creative is fatiguing and the fix is in your hands. For how CPM rolls into total spend, see our piece on Facebook ad spend and the companion on how much ads cost on Facebook.
Reading CPM against your real numbers
The hard part is not finding a benchmark. It is reconnecting CPM to per-order profit every week, across the spend, the margin on each product, and the fees — the data that lives in different places.
That reconnection is what Victor, the AI employee inside PodVector AI, does. Victor connects your Shopify store, Meta Ads, Google Ads, your print provider — Printify, Printful, or Gelato — and Klaviyo, then computes true per-order profit so a CPM number stops being a vanity metric and becomes a decision. Every write action Victor takes is approval-gated, and he can deliver the numbers as a report straight to your Google Drive. PodVector AI is not a dashboard you log into to read charts — it is an employee who does the reading for you and brings you the answer.
FAQs
What is a good Meta ads CPM for a POD store in 2025?
Treat the $8–$15 range as a sane planning band for US ecommerce, and expect apparel and art to sit at the top of it. But "good" is defined by your margin, not the band — a $9 CPM that produces an unprofitable cost per order is worse than a $16 CPM that clears your break-even ROAS.
Why is my CPM higher than the "average" I see quoted?
Most quoted averages are global and blended across objectives, which drags them down. US-only conversion campaigns in hot verticals like apparel run well above the global figure, and one report shows US CPM rising over 80% year on year. Your number is not broken; it is just being compared to the wrong benchmark.
Does a lower CPM mean cheaper customers?
No, and this trips up a lot of operators. A low CPM only means cheap impressions — if those impressions do not click and convert, your cost per order can still be high. The global average CPC sits around $0.82 and CTR around 2.46%, so you have to carry CPM all the way down to cost per order before you know if it was "cheap."
Why does my CPM spike in Q4?
Auction density. More advertisers compete for the same feeds around Black Friday and the holidays, so the market price of attention rises for everyone — it is not a penalty on your account. Your options are to widen your audience, accept the seasonal premium, or lean harder on margin levers so a higher CPM still clears profit.
How is CPM different from CPC and CPA?
CPM is cost per thousand impressions, CPC is cost per click, and CPA is cost per acquisition — each one is downstream of the last. CPM × your CTR gives you CPC, and CPC ÷ your conversion rate gives you CPA. Profit lives at the CPA end, which is why CPM alone can never tell you whether a campaign is working.