
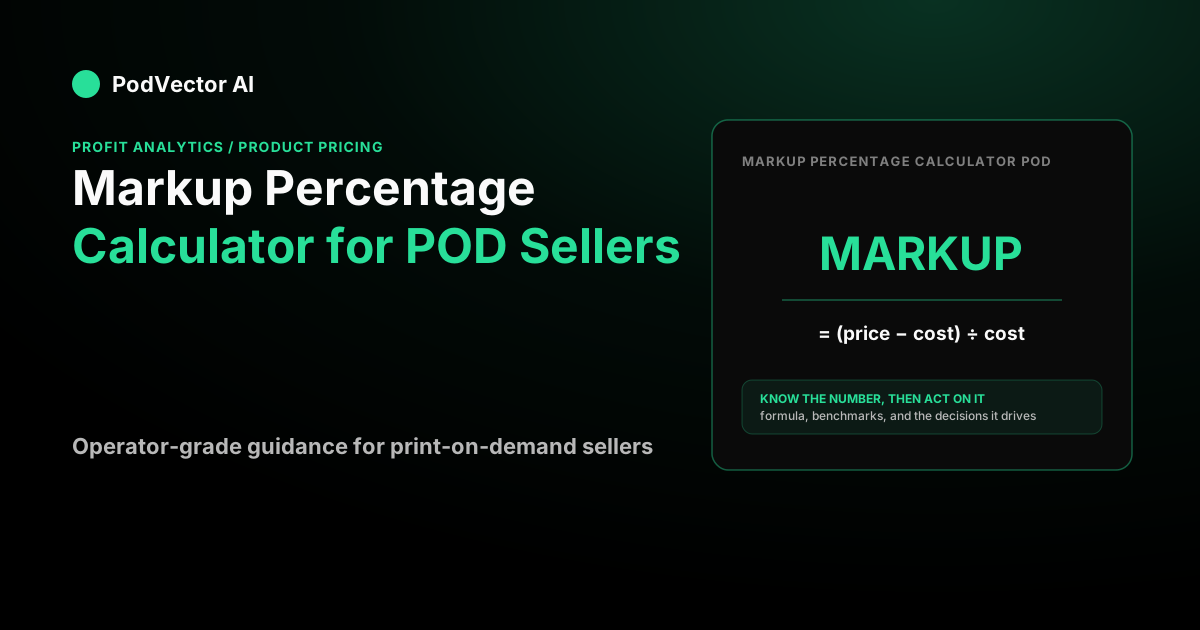
Every percentage markup calculator does the same arithmetic, whether it is labeled a retail markup calculator, a price markup calculator or a labor markup calculator: it measures the distance between what an item costs you and what you sell it for, expressed against cost. The formula never changes. What changes is whether that markup actually survives the rest of your cost stack.
If you run a store with real sales and real ad spend, the question is never "what number does the calculator show?" It is "does this price clear a profit after Meta takes its cut and Shopify takes its fee?" That is the gap most calculators skip, and it is the one that decides whether you keep the money.
Markup vs margin: the error the calculator hides
The single most expensive mistake in pricing is treating markup and margin as the same number. They describe the same dollar gap against different bases.
- Markup is the gap over cost:
(price − cost) ÷ cost × 100. - Margin is the gap over price:
(price − cost) ÷ price × 100. - To convert:
margin = markup ÷ (1 + markup)andmarkup = margin ÷ (1 − margin).
A $16 cost sold at $40 is a 150% markup and a 60% margin — the same $24 gap, two different numbers. This is pure arithmetic, not opinion. If someone tells you to "aim for 40% margin" and you punch 40% into a 40 markup calculator instead, you land at a 28.6% margin (0.40 ÷ 1.40) and underprice every unit without knowing it.
Supplier tools and marketplaces usually speak in markup; profit-and-loss statements and benchmarks speak in margin. Always name the base before you trust the output. Our margin vs. markup calculator walkthrough shows the conversion both ways with live numbers.
How to calculate markup percentage (and reverse it)
Say a printed tee costs you $12.00 from your supplier and you want to sell it at $34.99. The markup is ($34.99 − $12.00) ÷ $12.00 × 100 = 191.6%. The margin on the same sale is ($34.99 − $12.00) ÷ $34.99 × 100 = 65.7%. Both are correct; they just answer different questions.
A reverse markup calculator runs the formula backward. If you know your cost and the markup you want, price is cost × (1 + markup): a $12 cost at a 150% markup prices at $12 × 2.50 = $30.00. If you know the retail price and want to recover the cost, it is price ÷ (1 + markup). This is the move you make when a supplier raises base costs and you need to hold a target markup.
That arithmetic is the easy part. The hard part is that none of it accounts for the fees and ads an operating store actually pays.
What markup leaves out: the real POD cost stack
A markup number stops at product cost. Your store does not. Here is the same tee priced three ways, carrying its real costs: $12.00 product cost, $4.75 of shipping baked into a "free shipping" offer, payment processing, and a $10.00 blended ad cost per order.
The processing rate is real and current: on Shopify's Basic plan, Shopify Payments charges 2.9% + 30¢ per online card transaction, dropping to 2.7% and 2.5% on higher plans, per the Shopify pricing page. The table below applies the 2.9% + 30¢ rate; every other line is derived arithmetic.
| Line | @ $29.99 | @ $34.99 | @ $39.99 |
|---|---|---|---|
| Revenue | $29.99 | $34.99 | $39.99 |
| − Product cost | −$12.00 | −$12.00 | −$12.00 |
| = Gross margin | 60.0% | 65.7% | 70.0% |
| − Baked-in shipping | −$4.75 | −$4.75 | −$4.75 |
| − Processing (2.9% + 30¢) | −$1.17 | −$1.31 | −$1.46 |
| = Contribution before ads | $12.07 (40.2%) | $16.93 (48.4%) | $21.78 (54.5%) |
| Break-even ROAS (1 ÷ margin) | 2.49 | 2.07 | 1.84 |
| − Ad allocation | −$10.00 | −$10.00 | −$10.00 |
| = Profit after ads | $2.07 | $6.93 | $11.78 |
Three things this teaches that no markup calculator will:
Price is the highest-leverage number you own. Moving from $29.99 to $39.99 is a +33% price change but a +469% change in after-ad profit per order ($2.07 → $11.78). Nearly every added dollar of price flows straight to contribution; only the ~3¢ processing slice scales with it.
Your price sets the ROAS your ads must clear. At $29.99 your campaigns must hit a 2.49 return just to break even; at $39.99, only 1.84. Repricing re-grades every ad set overnight. This is why pricing and ad efficiency are the same conversation — covered in the product pricing guide.
A raise can afford to lose volume. Going from $29.99 to $34.99, contribution per order jumps from $12.07 to $16.93. You could lose up to 28.7% of your orders ($12.07 ÷ $16.93 = 0.713) and still bank the same pre-ad contribution dollars.
What markup should you actually target?
The two largest POD suppliers publish their own guidance, and it is worth citing because merchants trust their supplier's math.
Printful recommends a 20%–40% profit margin as a healthy POD range, noting basic t-shirts might only reach around 10% while premium or personalized products can clear 50% or higher; its worked example is a shirt sold at $25 against $15 of total cost, a 40% margin, per Printful's profit-margin guide. Printify aims higher, recommending 30%–50% margins by category using a cost-plus method, per Printify's pricing guide.
Read those numbers correctly. Both suppliers define "profit margin" as margin after their costs only — it still has to fund processing, apps and all of your ad spend. In the table above, the $29.99 tee is exactly a "40% margin" product in supplier language (40.2% contribution) and nets $2.07 after a $10 ad cost. The supplier's 30–50% is not take-home profit; it is the row before ads.
A retail markup that survives ad spend
For an operating store, the useful target is not a markup percentage — it is a price where contribution after fees and shipping is large enough to pay for the order's ads and still leave profit. Work backward from your real blended cost per order, not forward from a marketplace rule of thumb.
Once you have a target, the next question is whether you dare touch a live price. The upside is large and the risk is smaller than most sellers fear, but the move has to be tested against your actual conversion rate, not guessed. When you are ready to change prices at scale across your catalog, our rundown of repricing tools covers how to do it without tanking volume, and the competitive pricing playbook covers where your number has to sit against rivals.
Where PodVector AI fits
Running this math by hand per SKU, every time a supplier changes a base cost or a CPM moves, is where it breaks down. PodVector AI's AI employee, Victor, does it for you.
Victor knows each product's cost from Printify, Printful and Gelato before the first sale, sees every Shopify order and every Meta and Google ad dollar in the same place, and computes the true per-order profit after fees and shipping. He reprices the thin-margin SKUs in Shopify, pauses the ad sets that sit below a product's break-even ROAS, and shifts budget toward the SKUs that clear it. He is an AI employee who does the pricing work, not a calculator you have to feed.
See your true per-order profit with PodVector AI.
FAQs
What is a good markup percentage for print-on-demand?
There is no single right number — it depends on your product and your ad costs. Suppliers frame it as margin, not markup: Printful suggests a 20%–40% margin range, and Printify suggests 30%–50%. Remember both of those are measured after supplier costs only and still have to pay for your processing fees and ads, so treat them as a floor, not your take-home.
What does a 40% markup actually give me?
A 40% markup is a 28.6% margin, not a 40% margin. The conversion is margin = markup ÷ (1 + markup) = 0.40 ÷ 1.40 = 0.286. On a $12 cost, a 40% markup prices the item at $16.80. If you meant to earn a 40% margin, you need a 66.7% markup instead — this is exactly the mix-up a 40 markup calculator causes when people confuse the two bases.
How do I reverse a markup to find my cost or price?
A reverse markup calculator rearranges the same formula. To find price from cost and markup: price = cost × (1 + markup). To recover cost from a known price and markup: cost = price ÷ (1 + markup). For example, a $45 retail price at a 150% markup implies a cost of $45 ÷ 2.50 = $18.00.
Is markup the same as margin?
No. Markup is measured against cost; margin is measured against price. A 150% markup and a 60% margin describe the identical dollar gap. Mixing them up — applying a margin target as a markup — silently underprices your catalog by double digits.
Should my prices end in .99?
Often, but not always. In three field experiments, a $9 price ending raised demand every time, and the effect was strongest on new items, per Anderson and Simester's research summarized by Kellogg. The more useful lesson for an operating store is that within the same left digit, a higher 9-ending price can win on both demand and contribution — $39 beat $34 in their famous dress test.
Does a higher price always mean fewer orders?
Usually it converts slightly worse, but it can still make more money because each order carries more contribution. Judge a price change on revenue per visitor and profit per order, not conversion rate alone — conversion rate always flatters the lowest price. The volume-loss math above shows a $5 raise can shed over a quarter of your orders and still match the old contribution.