
If you run an operating store and you've opened Google Ads lately, "ROAS" is probably the number your eye lands on first. It looks like a verdict on whether the ads are working. It is only half of one.
This guide gives you the precise definition, shows you exactly where to read it inside Google Ads, then does the part the ranking pages skip: it walks the arithmetic that turns ROAS into actual profit for a real store.
What ROAS means in Google Ads
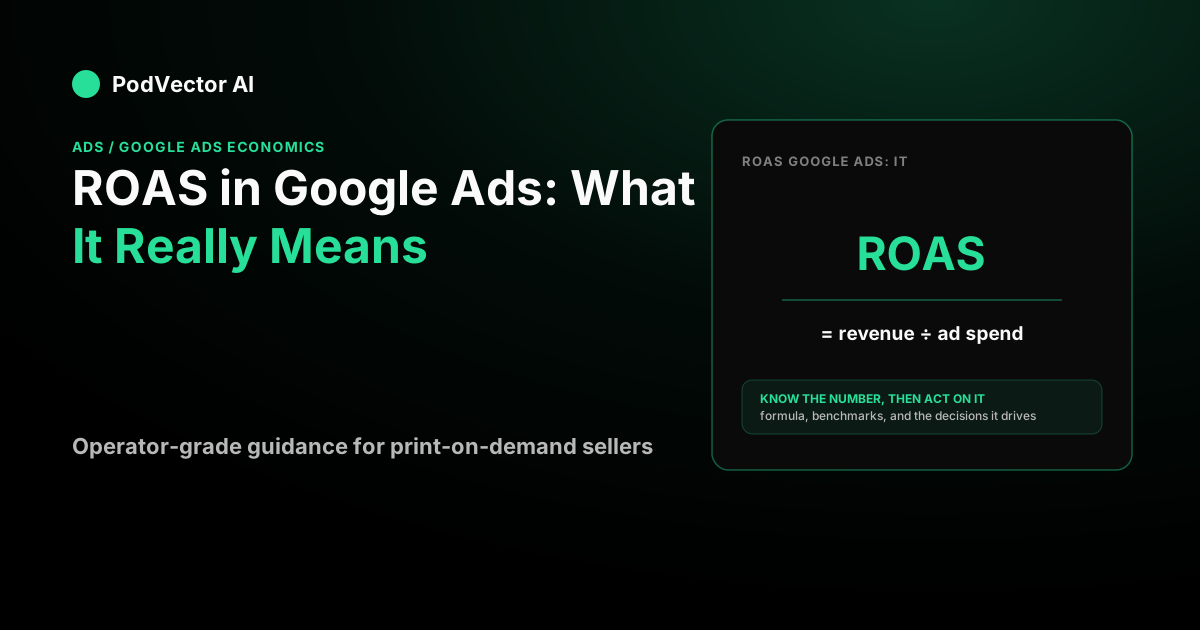
ROAS is return on ad spend. The formula is simple:
ROAS = conversion value ÷ ad spend.
Google expresses it two ways. As a multiple ("4.63") or as a percentage ("463%"). Both say the same thing — the revenue your campaigns are credited with, per dollar spent.
Say your store runs $3,200 in Google Ads spend this month and Google reports $14,800 in conversion value. Your ROAS is 14,800 ÷ 3,200 = 4.63, or 463%. Every ad dollar returned $4.63 in tracked sales.
The word "tracked" is doing real work there. ROAS is built entirely from what your conversion tracking records as value — not from your bank account. If the tag is firing on the wrong value, or a consent banner is dropping events, your ROAS is wrong in exactly the same direction.
ROAS vs ROI — not the same number
People use ROAS and ROI as if they're interchangeable. They aren't.
ROAS compares revenue to ad spend only. ROI compares profit to ad spend, after you subtract the cost of the product, the fulfillment, the shipping, and the processing fees. One number can look great while the other is underwater.
That gap is the whole reason a 4.63x ROAS doesn't automatically mean you made money. To know if you did, you need your margin.
Where to find ROAS inside Google Ads
You don't have to calculate ROAS by hand. Google Ads already has it.
In any campaign, Shopping, or Search view, click the Columns icon, open the Conversions column group, and add Conv. value / cost. That column is your ROAS — conversion value divided by cost, calculated for whatever date range you're viewing.
Add it at the campaign, ad group, and product level. The account-wide number hides the story; a 4x blended ROAS often means one campaign at 7x is carrying two at 1.5x. You want to see which is which before you touch a budget.
One caution: a single campaign's ROAS can look spectacular because it's quietly absorbing your branded search — traffic that was coming anyway. If a Performance Max campaign shows a huge return while your total order count is flat, that's the tell. The sibling guide on Performance Max campaign management walks through how to spot and fix that.
Why ROAS is not profit (the part most guides skip)
Here's the number that actually decides whether an ad is worth running: your break-even ROAS. It's pure arithmetic:
Break-even ROAS = 1 ÷ contribution margin.
Contribution margin is the share of each sale left after variable costs — product, shipping, fees — but before ad spend. Run the math for a print-on-demand order:
Say you sell a shirt for $34. Your Printify base cost is $12, shipping adds $4.50, and payment processing takes about $1.32 (roughly three percent plus thirty cents). That leaves $34 − $12 − $4.50 − $1.32 = $16.18 of contribution per order.
Your contribution margin is 16.18 ÷ 34 = 47.6%. So your break-even ROAS is 1 ÷ 0.476 = 2.10x. Below 2.10x you lose money on the ad; above it you make money.
Now the earlier example clicks into place. That 4.63x ROAS sits comfortably above a 2.10x break-even — the ads are genuinely profitable. But swap in a thinner product:
A mug priced at $24 with a $9 base cost, $4.50 shipping, and a $1 fee nets $9.50 — a 39.6% margin. Break-even ROAS jumps to 1 ÷ 0.396 = 2.53x. Same store, different SKU, and the bar for "profitable" moved. This is why one blended ROAS target across your whole catalog quietly loses money on your lowest-margin products.
The lesson competitors bury: a high ROAS can still lose money, and a modest ROAS can print profit. It depends entirely on your margin. Google's own help docs on ROAS bidding explain the mechanics; the margin math above is what makes them actionable.
What counts as a "good" ROAS?
There's no universal good ROAS, because break-even moves with your margin. But benchmarks give you a sense of the terrain.
For the retail-style category (Shopping, Collectibles & Gifts), LocaliQ's 2026 search benchmarks report an average cost-per-click of $4.14 and a conversion rate of about 4.01%, against an all-industry average CPC of $5.42 (LocaliQ 2026 benchmarks). Retail clicks run cheaper than average, which helps — but your conversion rate and order value decide whether that $4.14 click pays off.
On targets specifically, WebFX's 2026 aggregate frames a healthy ecommerce target ROAS in the range of four to six times spend, as one vendor's book of business rather than a rule (WebFX 2026 benchmarks). Treat that as context, not a goal. A four-times target is generous if your break-even is 2.1x and ruinous if your real break-even sits at 4x on a thin-margin line.
The honest framing: benchmarks tell you what other advertisers see; break-even math tells you what you can afford. Only the second one is decisional.
ROAS and the Target ROAS bid strategy
Google will also let you bid toward a ROAS. The Target ROAS (tROAS) strategy takes a target you set and adjusts bids at each auction to chase that return.
The trap is setting the target from a blog post instead of your own numbers. Derive it: take your break-even ROAS and add a profit buffer. If your break-even is 2.1x and you want a cushion, a target around 2.5x to 3.1x leaves real margin. Setting it to "5x because that sounds good" doesn't force efficiency — it starves volume.
Google says this plainly: "setting a target that's too high may limit the amount of traffic your ads may get" (Google Ads Help — About Target ROAS). An aggressive target doesn't make the account more efficient; the system just declines auctions it predicts won't clear the bar, and your spend collapses.
Two more things to know before you switch it on. Target ROAS needs at least 15 conversions in the past 30 days for Search and Shopping campaigns to even be eligible (Google Ads Help), and most practitioners want closer to 30–50 a month before the bidding behaves stably. After you change the target, give it a conversion cycle or two to recalibrate before you judge it.
For stores leaning on Shopping and feed-based campaigns, the economics of getting that target right is where a specialist earns their fee — the down-funnel work a Google Shopping ads agency handles day to day. The full picture of how these pieces fit sits in the Google Ads economics guide.
Turning ROAS into true profit, automatically
The reason ROAS misleads is structural: Google Ads sees revenue, not your costs. Your Printify invoice, your shipping, your Shopify fees, and your Meta spend all live somewhere else. To know real per-order profit you have to stitch them together — and almost nobody does it per product, every day.
That's the job PodVector AI built Victor to do. Victor is an AI employee who connects your Shopify store, Google Ads, Meta Ads, Printify, Printful, Gelato, and Klaviyo, and computes the true per-order profit on every product — ad spend, supplier cost, shipping, and fees netted out, not just the ROAS Google shows you.
And Victor acts on it inside Google Ads. He pauses the campaign bleeding money below break-even, raises bids on the SKUs that clear it, and adjusts budgets toward the products that actually net a profit. He delivers the profit report to your Google Drive so you're reading the number that matters, not the one that flatters. Victor is not a dashboard you have to go check — he does the work.
Put Victor on your store and let him tell you which ads make money, per order, across every channel.
FAQs
What does ROAS stand for in Google Ads?
ROAS stands for return on ad spend. It's the conversion value your campaigns generate divided by the amount you spent on those ads, shown in Google Ads as a multiple or a percentage.
How do I calculate ROAS?
Divide the revenue (conversion value) your ads produced by your ad spend. If you spent $3,200 and Google credits $14,800 in conversion value, your ROAS is 14,800 ÷ 3,200 = 4.63, or 463%. Inside Google Ads, add the "Conv. value / cost" column and it's calculated for you.
Is a higher ROAS always better?
No. A higher ROAS is better only relative to your break-even point, which is 1 ÷ your contribution margin. A 5x ROAS is strong on a 50% margin product and can still lose money on a product whose margin is thin enough to push break-even above 5x. Always compare ROAS to your own break-even, not to a benchmark.
What is a good ROAS for an ecommerce store?
It depends on your margin, so there's no single answer. As context, WebFX's 2026 data frames healthy ecommerce targets around four to six times spend (WebFX), but your real floor is your break-even ROAS. On a 40% contribution margin that floor is 2.5x; on a 50% margin it's 2.0x.
What's the difference between ROAS and ROI?
ROAS compares revenue to ad spend only. ROI compares profit to ad spend after subtracting product cost, shipping, and fees. ROAS can look healthy while ROI is negative, which is exactly why thin-margin print-on-demand sellers need to watch profit, not just ROAS.
How does Target ROAS bidding work?
Target ROAS is a Google Ads smart bidding strategy where you set a return target and Google adjusts bids at each auction to chase it. It needs at least 15 conversions in the past 30 days for Search and Shopping campaigns (Google Ads Help), and setting the target far above what your account has historically achieved suppresses volume rather than improving efficiency.
Why does my ROAS look great but my bank account doesn't?
Usually one of three things: the ROAS ignores your product and fulfillment costs (so it was never profit), a campaign is absorbing branded traffic that would have converted for free, or your conversion tracking is counting value your store never actually banked. The fix is to measure true per-order profit across every channel, not per-campaign ROAS.