
CPM is the easiest Google Ads number to look up and the easiest one to misread. A low cost per 1,000 impressions feels like a win, but impressions do not pay your supplier. This guide breaks down what CPM really is, what it runs by network, and how to translate it into the only figure that keeps your store alive: profit per order.
What "cost per 1,000 impressions" actually means
CPM stands for cost per mille — cost per one thousand impressions. Google defines it plainly: it is "a way to bid where you pay per one thousand views (impressions) on the Google Display Network," per Google Ads Help. An impression is one appearance of your ad, whether or not anyone clicks.
Google also runs viewable CPM (vCPM), where you "only pay when your ads can be seen," again per Google Ads Help. That matters because an ad served below the fold still counts as a served impression but may never enter a shopper's view.
Here is the catch most CPM articles skip. Only some Google campaigns actually bill by the thousand — Display, YouTube, and some Demand Gen placements. Search and Shopping bill by the click or by conversion value, so their "CPM" is a reported diagnostic, not a price you pay. When you compare CPMs across networks, you are comparing a true billing unit against a derived stat.
How to calculate CPM
The formula is simple arithmetic:
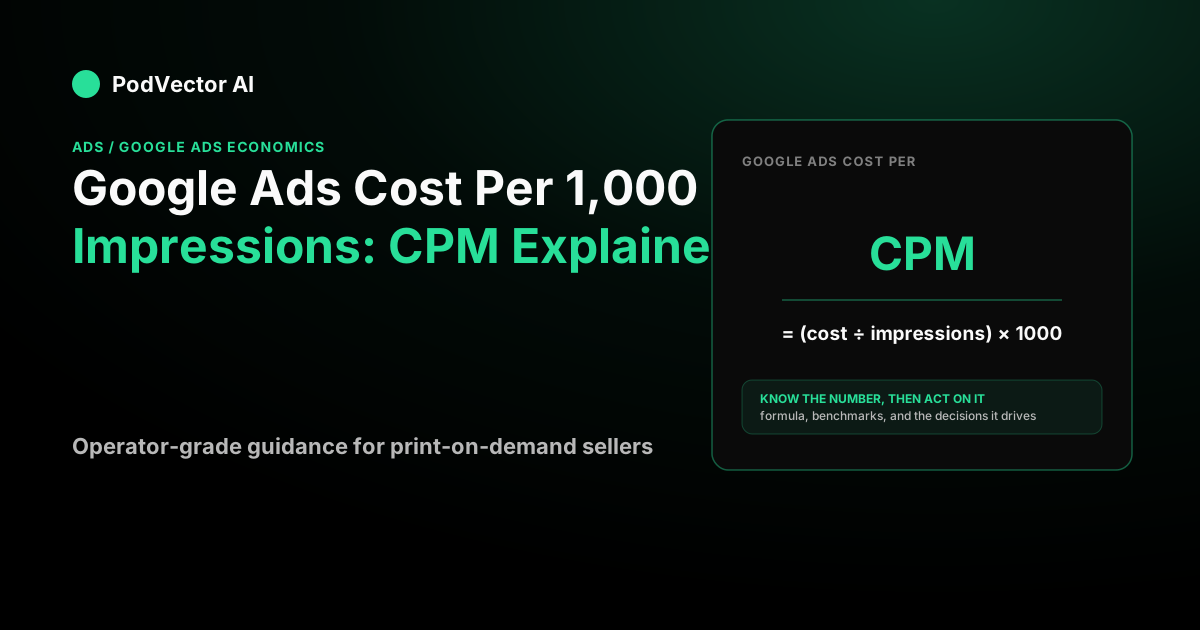
CPM = (ad spend ÷ impressions) × 1,000
Say you spend $600 on a Display prospecting campaign and it serves 150,000 impressions. Your CPM is $600 ÷ 150,000 × 1,000 = $4.00. Flip it to budget a reach goal: if you want 500,000 impressions at a $4 CPM, that is 500 thousand-blocks × $4 = $2,000 in spend.
That reversibility is why CPM is useful for planning reach. It is also why it is dangerous for judging results — nothing in that math touches a single order.
Average Google Ads CPM by network
CPM swings enormously by placement, audience, and industry, so treat any single figure as a reference point, not a target. The table below pulls from sourced 2026 data.
| Network / campaign type | Typical CPM | Source |
|---|---|---|
| Display Network (all industries) | ~$3.12 | NestScale 2026 |
| Display — retail / ecommerce | $0.50–$2.00 | NestScale 2026 |
Those Display figures come from NestScale's 2026 CPM data. The gap between a ~$3 Display CPM and premium placements is the whole story: premium YouTube and high-intent Search placements cost far more per thousand than cheap Display inventory, and the mix you run moves your blended number more than any single bid does.
For the full picture of how these costs connect to bids, budgets, and returns, read our Google Ads economics guide.
What drives your CPM up or down
Five levers move your cost per 1,000 impressions, and most of them are inside your control.
- Placement. Cheap Display inventory sits far below premium YouTube or in-feed Shopping placements. Running broad Display pulls your CPM down; it rarely pulls profit up.
- Targeting tightness. Narrow, high-value audiences cost more per impression because more advertisers want them. A looser audience looks cheaper per thousand and usually converts worse.
- Competition and seasonality. Q4 and BFCM crowd the auction. Costs have been climbing for years — WordStream's 2025 benchmarks, reported via Search Engine Land, found roughly 87% of industries saw year-over-year cost-per-click increases, averaging about 12.9%.
- Ad quality and relevance. Stronger creative and tighter ad-to-landing-page relevance earn better auction treatment, which can lower what you pay to appear.
- Format. Video, responsive display, and Shopping units price differently even to the same shopper.
Lowering CPM is easy if that is all you chase — just buy broader, cheaper inventory. Whether that helps your store is a different question entirely.
Why a cheap CPM can still lose you money
This is where most CPM content stops and your P&L starts. Impressions are not revenue. A rock-bottom CPM on an audience that never buys is the most expensive kind of cheap.
Walk a realistic example. Say your store runs a $1,200/month Display and YouTube prospecting push at a $6 CPM. That buys 200,000 impressions. At a 0.6% click-through rate you get 1,200 clicks, and at a 2% conversion rate that is 24 orders.
Now add the economics. Say your average order value is $34 and your contribution margin — price minus product cost from Printify, shipping, and processing fees — is 38%. That is $34 × 0.38 = $12.92 of contribution per order. Twenty-four orders return 24 × $12.92 = $310.08.
You spent $1,200 to make $310 in contribution. The CPM was "cheap," and the campaign lost about $890. A $6 CPM tells you nothing about that; only the order-level math does. (For context, retail search clicks alone average $4.14, per LocaliQ's 2026 benchmarks — so cheap impressions can mask expensive customers.)
From impressions to break-even
The bridge from CPM to profit is your break-even ROAS, which is pure arithmetic:
Break-even ROAS = 1 ÷ contribution margin
At a 38% contribution margin, that is 1 ÷ 0.38 = 2.63x. Every ad dollar has to return $2.63 in revenue just to break even. If you run value-based bidding, that number — not a CPM benchmark — is where your target ROAS should start, usually set a step above break-even once the account has the conversion volume to support it.
So read CPM as a reach-planning input, nothing more. Judge campaigns on contribution after product and fulfillment costs. If you sell on Shopping and want to attack the CPC side of that equation, our breakdown of using a CSS for Google Shopping shows where real savings live, and if you would rather hand the account off, here is what a Google Shopping ads agency actually does.
Where Victor fits
Victor is the AI employee inside PodVector AI, and he closes the exact gap this article describes. Victor connects your Google Ads, Meta Ads, and Shopify, and pulls product costs from Printify, Printful, and Gelato — so he sees every impression you paid for and the true profit on every order it produced, together.
When a campaign buys cheap impressions and no profitable orders, Victor works your Google Ads account directly: he pauses the losing campaign, shifts budget toward the audiences that clear your break-even, and adjusts bids against your real margin instead of a vanity CPM. He computes your true per-order profit, builds and sends Klaviyo flows to lift repeat revenue, and delivers the reports to your Google Drive.
Put Victor on your ad math and stop grading campaigns on how little they cost per thousand views.
FAQs
What is a good CPM for Google Ads?
There is no universal "good" CPM — it depends on network and audience. Retail and ecommerce Display often runs $0.50–$2.00, while premium YouTube and high-intent Search placements cost far more per thousand, per NestScale and KlientBoost. A "good" CPM is one that still leaves profit after you trace it to orders — a high CPM on a converting audience beats a low one that never buys.
Is CPM or CPC better for an ecommerce store?
They answer different questions. CPM bidding buys reach and awareness; CPC and conversion-based bidding buy outcomes you can tie to revenue. For a store with real sales history, value-based bidding against your margin usually beats paying flat for impressions, because it optimizes toward orders rather than views.
Does Google Shopping use CPM?
Not as its billing model. Shopping and Search charge by the click or optimize toward conversion value, so any CPM you see there is a reported diagnostic, not a price. CPM billing lives on Display, YouTube, and some Demand Gen placements, per Google Ads Help.
How do I lower my Google Ads CPM?
Tighten placements, improve ad relevance and creative quality, and avoid the most crowded seasonal windows when you can. But be careful what you wish for — the fastest way to cut CPM is to buy broad, cheap inventory, which usually converts worse. Optimize for cost per profitable order, not cost per thousand impressions.
Why did my CPM suddenly go up?
The usual causes are auction density (a competitor entered, or you are in Q4), a shift toward more premium placements like YouTube, or a drop in ad relevance. Costs have also trended up structurally — roughly 87% of industries saw year-over-year increases in WordStream's 2025 data. Check what changed in your placement mix before you blame the bid.